amazon Web Services is excited to announce the launch of the AWS Neuron Monitor container, an innovative tool designed to enhance the monitoring capabilities of AWS Inferentia and AWS Trainium chips on amazon Elastic Kubernetes Service (amazon EKS). This solution simplifies the integration of advanced monitoring tools such as Prometheus and Grafana, enabling you to set up and manage your machine learning (ML) workflows with AWS ai Chips. With the new Neuron Monitor container, you can visualize and optimize the performance of your ML applications, all within a familiar Kubernetes environment. The Neuron Monitor container can also run on amazon Elastic Container Service (amazon ECS), but for the purpose of this post, we primarily discuss amazon EKS deployment.
In addition to the Neuron Monitor container, the release of CloudWatch Container Insights (for Neuron) provides further benefits. This extension provides a robust monitoring solution, offering deeper insights and analytics tailored specifically for Neuron-based applications. With Container Insights, you can now access more granular data and comprehensive analytics, making it effortless for developers to maintain high performance and operational health of their ML workloads.
Solution overview
The Neuron Monitor container solution provides a comprehensive monitoring framework for ML workloads on amazon EKS, using the power of Neuron Monitor in conjunction with industry-standard tools like Prometheus, Grafana, and amazon CloudWatch. By deploying the Neuron Monitor DaemonSet across EKS nodes, developers can collect and analyze performance metrics from ML workload pods.
In one flow, metrics gathered by Neuron Monitor are integrated with Prometheus, which is configured using a Helm chart for scalability and ease of management. These metrics are then visualized through Grafana, offering you detailed insights into your applications’ performance for effective troubleshooting and optimization.
Alternatively, metrics can also be directed to CloudWatch through the CloudWatch Observability EKS add-on or a Helm chart for a deeper integration with AWS services in a single step. The add-on helps automatically discover critical health metrics from the AWS Trainium and AWS Inferentia chips in the amazon EC2 Trn1 and amazon EC2 Inf2 instances, as well as from Elastic Fabric Adapter, the network interface for EC2 instances.. This integration can help you better understand the traffic impact on your distributed deep learning algorithms.
This architecture has many benefits:
- Highly targeted and intentional monitoring on Container Insights
- Real-time analytics and greater visibility into ML workload performance on Neuron
- Native support for your existing amazon EKS infrastructure
Neuron Monitor provides flexibility and depth in monitoring within the Kubernetes environment.
The following diagram illustrates the solution architecture:
Fig.1 Solution Architecture Diagram
In the following sections, we demonstrate how to use Container Insights for enhanced observability, and how to set up Prometheus and Grafana for this solution.
Configure Container Insights for enhanced observability
In this section, we walk through the steps to configure Container Insights.
Set up the CloudWatch Observability EKS add-on
Refer to Install the amazon CloudWatch Observability EKS add-on for instructions to create the amazon-cloudwatch-observability add-on in your EKS cluster. This process involves deploying the necessary resources for monitoring directly within CloudWatch.
After you set up the add-on, check the health of the add-on with the following command:
The output should contain the following property value:
For details about confirming the output, see Retrieve addon version compatibility.
Once the add-on is active, you can then directly view metrics in Container Insights.
View CloudWatch metrics
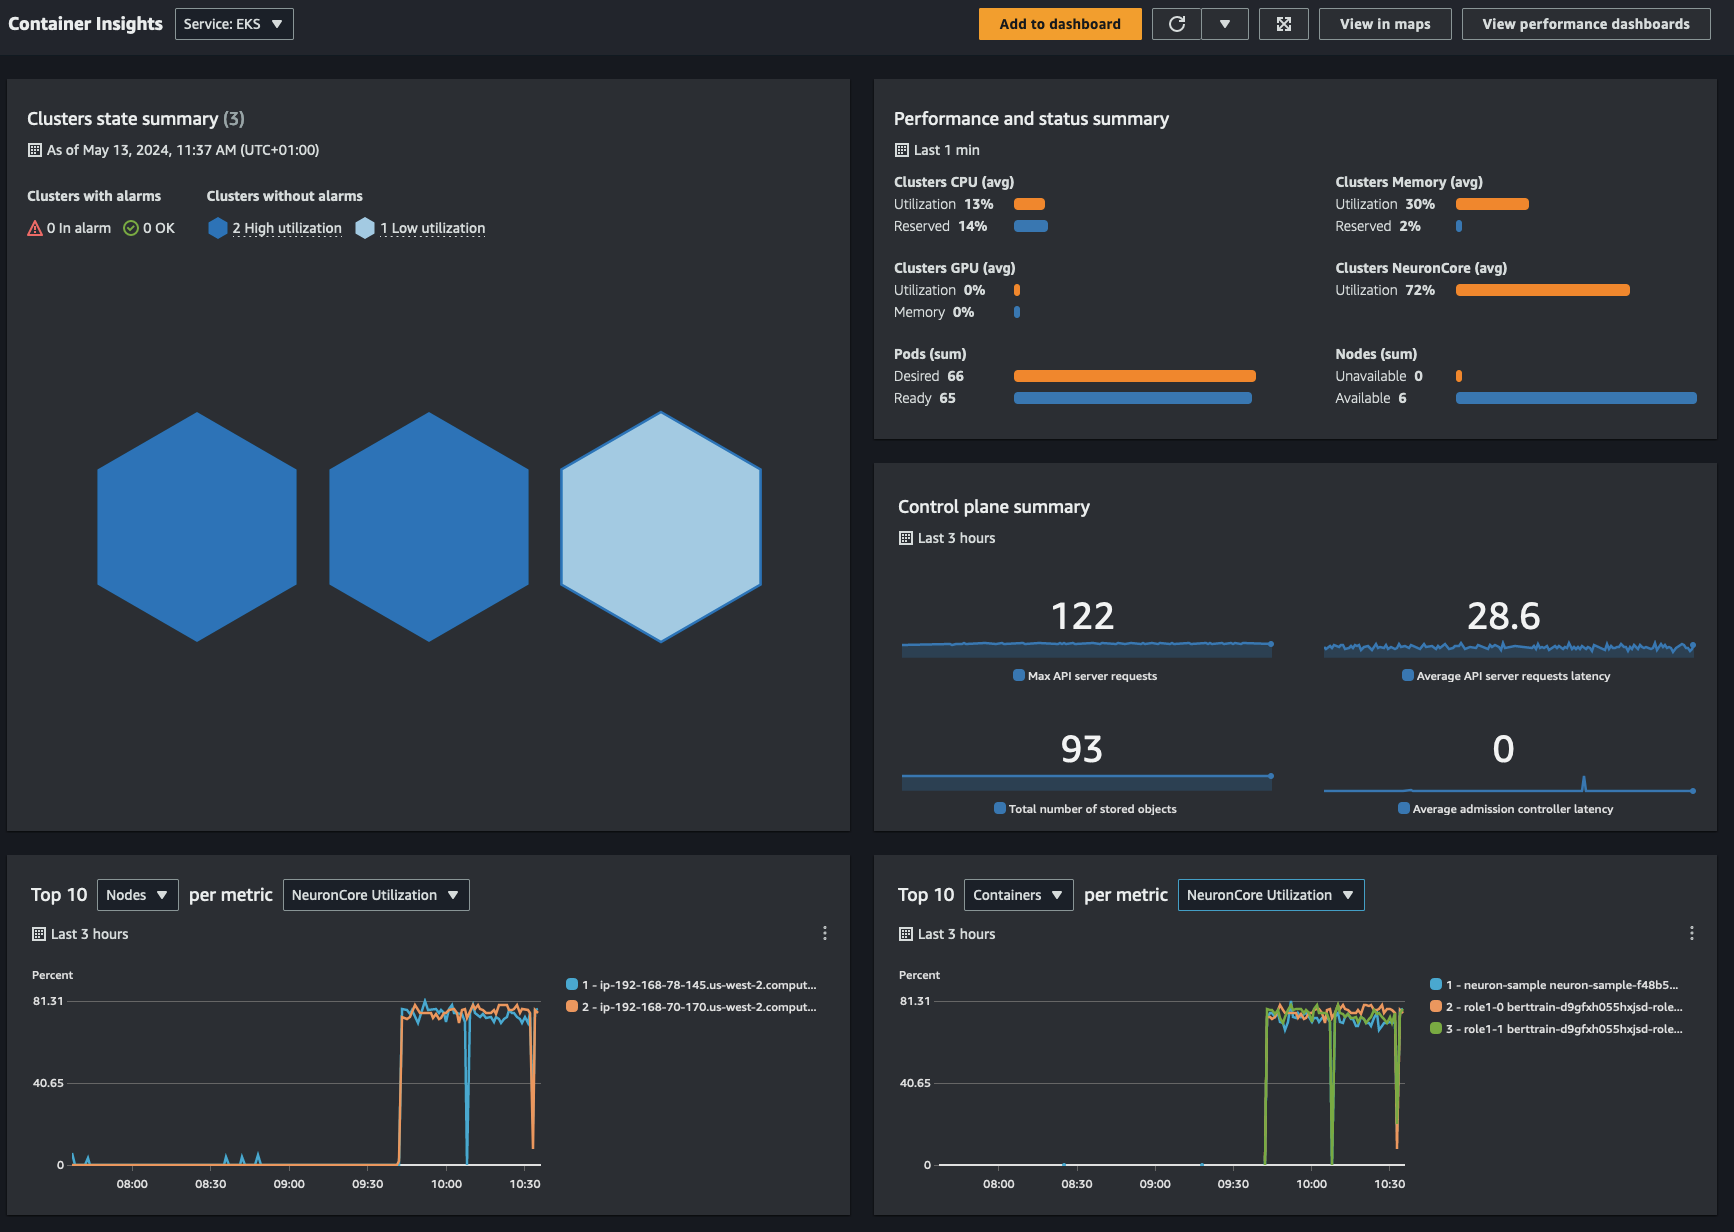
Navigate to the Container Insights console, where you can visualize metrics and telemetry about your whole amazon EKS environment, including your Neuron device metrics. The enhanced Container Insights page looks similar to the following screenshot, with the high-level summary of your clusters, along with kube-state and control-plane metrics. The Container Insights dashboard also shows cluster status and alarms. It uses predefined thresholds for CPU, memory, and NeuronCores to quickly identify which resources have higher consumption, and enables proactive actions to avoid performance impact.

Fig.2 CloudWatch Container Insights Dashboard
The out-of-the-box opinionated performance dashboards and troubleshooting UI enables you to see your Neuron metrics at multiple granularities from an aggregated cluster level to per-container level and per-NeuronCore level. With the Container Insights default configuration, you can also qualify and correlate your Neuron metrics against the other aspects of your infrastructure such as CPU, memory, disk, Elastic Fabric Adapter devices, and more.
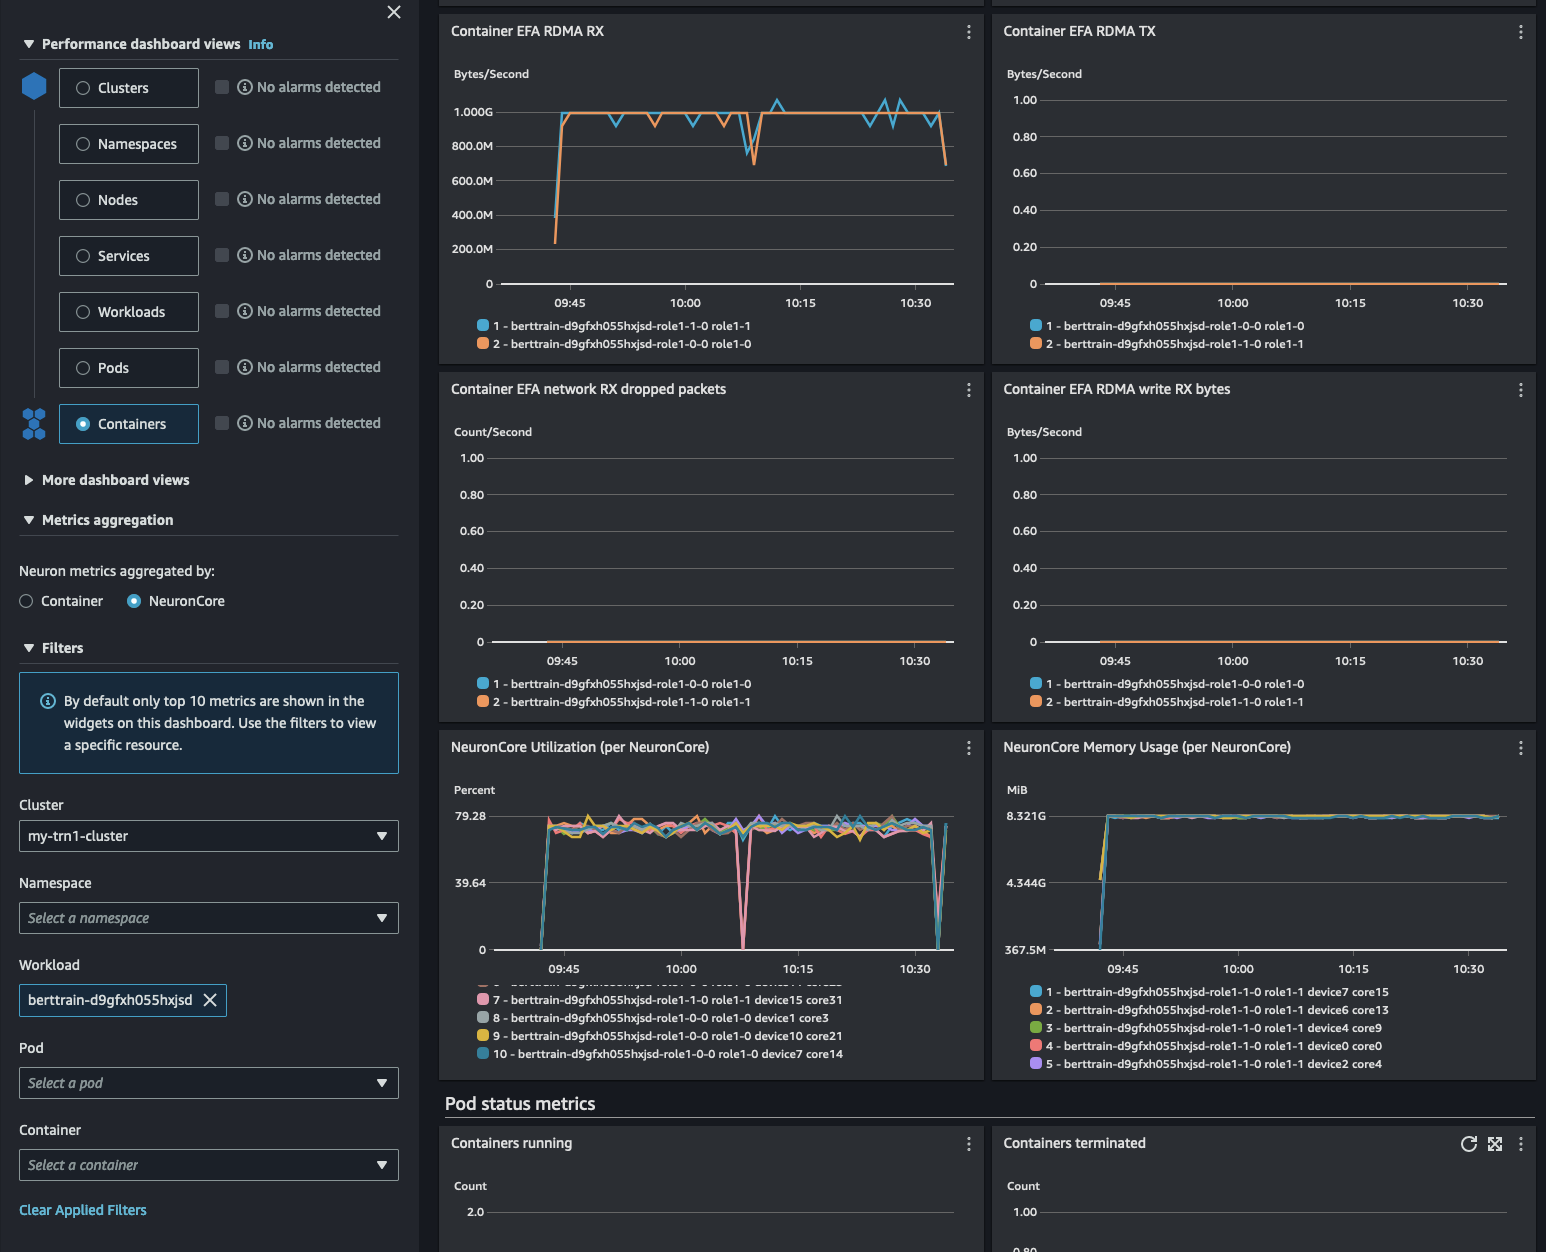
When you navigate to any of the clusters based on their criticality, you can view the Performance monitoring dashboard, as shown in the following screenshot.

Fig.3 Performance Monitoring Dashboard Views
This monitoring dashboard provides various views to analyze performance, including:
- Cluster-wide performance dashboard view – Provides an overview of resource utilization across the entire cluster
- Node performance view – Visualizes metrics at the individual node level
- Pod performance view – Focuses on pod-level metrics for CPU, memory, network, and so on
- Container performance view – Drills down into utilization metrics for individual containers
This landing page has now been enhanced with Neuron metrics, including top 10 graphs, which helps you identify unhealthy components in your environments even without alarms and take proactive action before application performance is impacted. For a more in-depth analysis of what is delivered on this landing page, refer to Announcing amazon CloudWatch Container Insights with Enhanced Observability for amazon EKS on EC2.
Prometheus and Grafana
In this section, we walk through the steps to set up Prometheus and Grafana.
Prerequisites
You should have an EKS cluster set up with AWS Inferentia or Trainium worker nodes.
Set up the Neuron Monitoring container
The Neuron Monitoring container is hosted on amazon ECR Public. Although it’s accessible for immediate use, it’s not a recommended best practice for direct production workload use due to potential throttling limits. For more information on this and on setting up a pull through cache, see the Neuron Monitor User Guide. For production environments, it’s advisable to copy the Neuron Monitoring container to your private amazon Elastic Container Registry (amazon ECR) repository, where the amazon ECR pull through cache feature can manage synchronization effectively.
Set up Kubernetes for Neuron Monitoring
You can use the following YAML configuration snippet to set up Neuron Monitoring in your Kubernetes cluster. This setup includes a DaemonSet to deploy the monitoring container on each suitable node in namespace neuron-monitor:
To apply this YAML file, complete the following steps:
- Replace
with the URI of the Neuron Monitoring container image in your ECR repository. - Run the YAML file with the Kubernetes command line tool with the following code:
- Verify the Neuron Monitor container is running as DaemonSet:
Set up amazon Managed Service for Prometheus
To utilize amazon Managed Service for Prometheus with your EKS cluster, you must first configure Prometheus to scrape metrics from Neuron Monitor pods and forward them to the managed service.
Prometheus requires the Container Storage Interface (CSI) in the EKS cluster. You can use eksctl to set up the necessary components.
- Create an AWS Identity and Access Management (IAM) service account with appropriate permissions:
- Verify the add-on installation:
Now you’re ready to set up your amazon Managed Service for Prometheus workspace.
- Create a workspace using the AWS Command Line Interface (AWS CLI) and confirm its active status:
- Set up the required service roles following the AWS guidelines to facilitate the ingestion of metrics from your EKS clusters. This includes creating an IAM role specifically for Prometheus ingestion:
Next, you install Prometheus in your EKS cluster using a Helm chart, configuring it to scrape metrics from Neuron Monitor and forward them to your amazon Managed Service for Prometheus workspace. The following is an example of the Helm chart .yaml file to override the necessary configs:
This file has the following key sections:
- serviceAccounts – Configures the service account used by Prometheus with the necessary IAM role for permissions to ingest metrics
- remoteWrite – Specifies the endpoint for writing metrics to amazon Managed Service for Prometheus, including AWS Region-specific details and batch-writing configurations
- extraScrapeConfigs – Defines additional configurations for scraping metrics from Neuron Monitor pods, including selecting pods based on labels and making sure only relevant metrics are captured
- Install Prometheus in your EKS cluster using the Helm command and specifying the .yaml file:
- Verify the installation by checking that all Prometheus pods are running:
This confirms that Prometheus is correctly set up to collect metrics from the Neuron Monitor container and forward them to amazon Managed Service for Prometheus.
Integrate amazon Managed Grafana
When Prometheus is operational, complete the following steps:
- Set up amazon Managed Grafana. For instructions, see Getting started with amazon Managed Grafana.
- Configure it to use amazon Managed Service for Prometheus as a data source. For details, see Use AWS data source configuration to add amazon Managed Service for Prometheus as a data source.
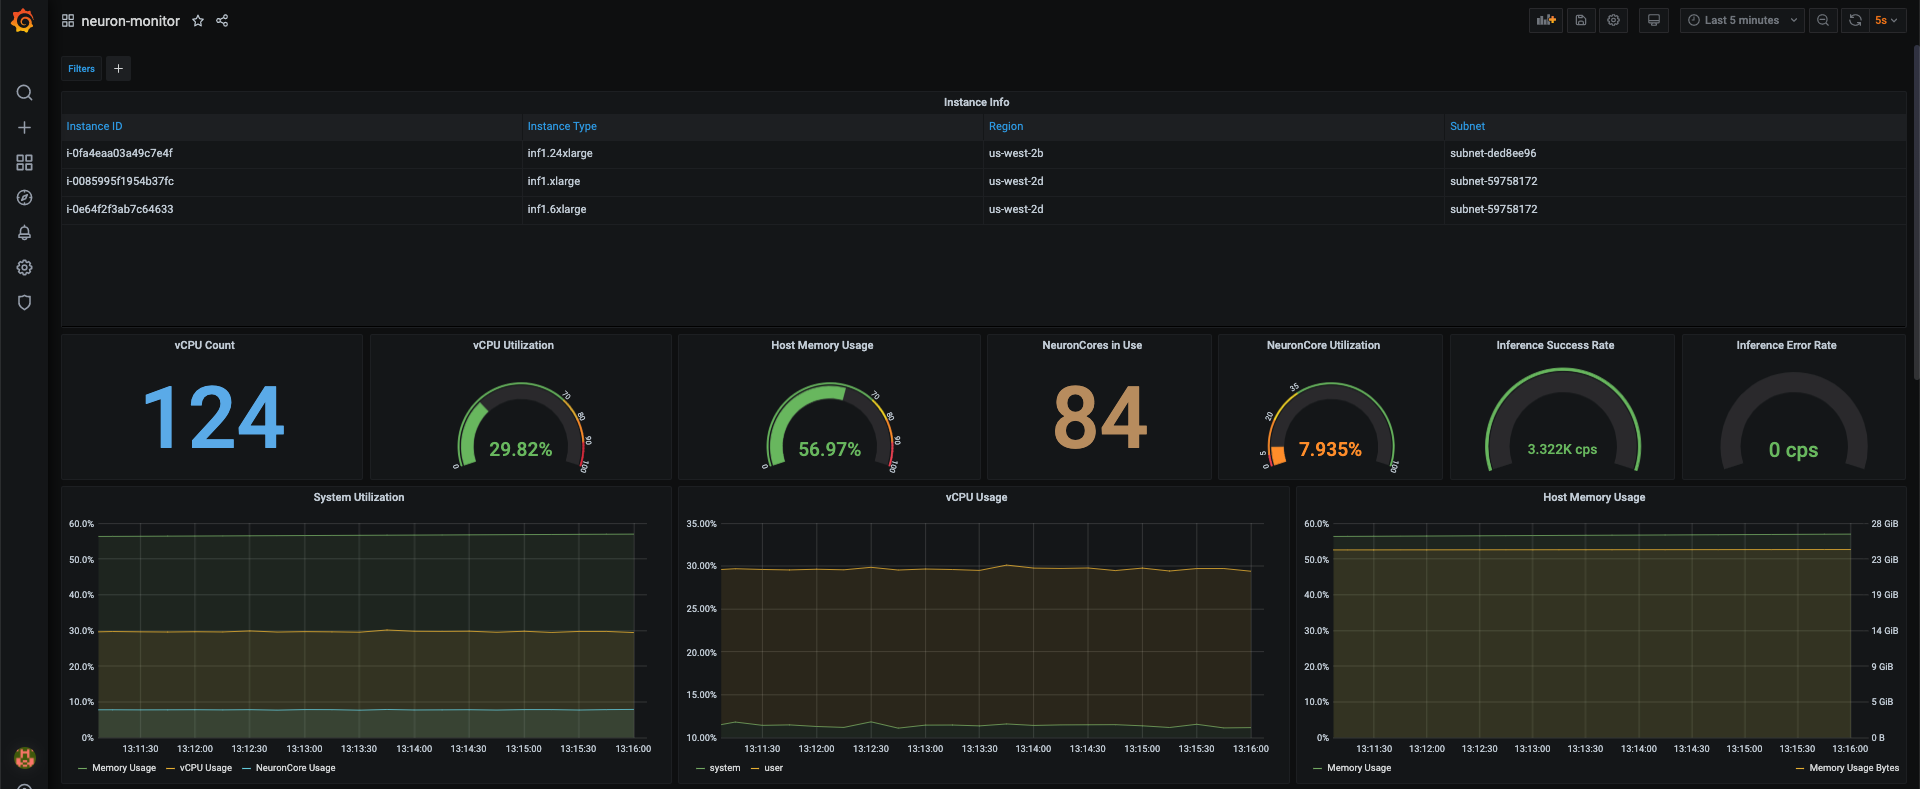
- Import the example Neuron Monitor dashboard from GitHub to quickly visualize your metrics.
The following screenshot shows your dashboard integrated with amazon Managed Grafana.

Fig.4 Integrating amazon Managed Grafana
Clean up
To make sure none of the resources created in this walkthrough are left running, complete the following cleanup steps:
- Delete the amazon Managed Grafana workspace.
- Uninstall Prometheus from the EKS cluster:
- Remove the amazon Managed Service for Prometheus workspace ID from the trust policy of the role
amp-iamproxy-ingest-roleor delete the role. - Delete the amazon Managed Service for Prometheus workspace:
- Clean up the CSI:
- Delete the Neuron Monitor DaemonSet from the EKS cluster:
Conclusion
The release of the Neuron Monitor container marks a significant enhancement in the monitoring of ML workloads on amazon EKS, specifically tailored for AWS Inferentia and Trainium chips. This solution simplifies the integration of powerful monitoring tools like Prometheus, Grafana, and CloudWatch, so you can effectively manage and optimize your ML applications with ease and precision.
To explore the full capabilities of this monitoring solution, refer to Deploy Neuron Container on Elastic Kubernetes Service (EKS). Refer to amazon EKS and Kubernetes Container Insights metrics to learn more about setting up the Neuron Monitor container and using Container Insights to fully harness the capabilities of your ML infrastructure on amazon EKS. Additionally, engage with our community through our GitHub repo to share experiences and best practices, so you stay at the forefront of ML operations on AWS.
About the Authors
 Niithiyn Vijeaswaran is a Solutions Architect at AWS. His area of focus is generative ai and AWS ai Accelerators. He holds a Bachelor’s degree in Computer Science and Bioinformatics. Niithiyn works closely with the Generative ai GTM team to enable AWS customers on multiple fronts and accelerate their adoption of generative ai. He’s an avid fan of the Dallas Mavericks and enjoys collecting sneakers.
 Emir Ayar is a Senior tech Lead Solutions Architect with the AWS Prototyping team. He specializes in assisting customers with building ML and generative ai solutions, and implementing architectural best practices. He supports customers in experimenting with solution architectures to achieve their business objectives, emphasizing agile innovation and prototyping. He lives in Luxembourg and enjoys playing synthesizers.
 Ziwen Ning is a software development engineer at AWS. He currently focuses on enhancing the ai/ML experience through the integration of AWS Neuron with containerized environments and Kubernetes. In his free time, he enjoys challenging himself with badminton, swimming and other various sports, and immersing himself in music.
 Rohit Talluri is a Generative ai GTM Specialist (tech BD) at amazon Web Services (AWS). He is partnering with top generative ai model builders, strategic customers, key ai/ML partners, and AWS Service Teams to enable the next generation of artificial intelligence, machine learning, and accelerated computing on AWS. He was previously an Enterprise Solutions Architect, and the Global Solutions Lead for AWS Mergers & Acquisitions Advisory.
 Albert Opher is a Solutions Architect Intern at AWS. He is a rising senior at the University of Pennsylvania pursuing Dual Bachelor’s Degrees in Computer Information Science and Business Analytics in the Jerome Fisher Management and technology Program. He has experience with multiple programming languages, AWS cloud services, ai/ML technologies, product and operations management, pre and early seed start-up ventures, and corporate finance.
 Geeta Gharpure is a senior software developer on the Annapurna ML engineering team. She is focused on running large scale ai/ML workloads on Kubernetes. She lives in Sunnyvale, CA and enjoys listening to audible in her free time


