Image generated with ChatGPT
Pandas is one of the most popular data analysis and manipulation tools, known for its ease of use and powerful capabilities. But did you know that you can also use it to create and run data pipelines to process and analyze data sets?
In this tutorial, we will learn how to use the Pandas “pipe” method to build end-to-end data science pipelines. The pipeline includes several steps such as data ingestion, data cleaning, data analysis, and data visualization. To highlight the benefits of this approach, we will also compare pipeline-based code with non-pipeline alternatives, giving you a clear understanding of the differences and advantages.
What is a Pandas pipe?
Pandas' `pipe` method is a powerful tool that allows users to chain together multiple data processing functions in a clear and readable manner. This method can handle positional and keyword arguments, making it flexible for various custom functions.
In summary, the Pandas `pipe` method:
- Improves code readability
- Enables function chaining
- Supports custom functions
- Improves code organization
- Efficient for complex transformations
Here is the code example of `pipe` function. We have applied Python `clean` and `analysis` functions to the Pandas DataFrame. The pipe method will first clean the data, perform data analysis and return the result.
(
    df.pipe(clean)
    .pipe(analysis)
)
Pandas code without pipelining
First, we will write some simple data analysis code without using pipelines so that we have a clear comparison of when we use pipelines to simplify our data processing flow.
For this tutorial, we will be using the Online Sales Dataset: Popular Markets Data from Kaggle containing information on online sales transactions in different product categories.
- We will load the CSV file and display the first three rows of the dataset.
import pandas as pd
df = pd.read_csv('/work/Online Sales Data.csv')
df.head(3)

- Clean the dataset by removing duplicates and missing values and reset the index.
- Convert column types. We will convert “Product Category” and “Product Name” to strings and the “Date” column to date type.
- To perform the analysis, we will create a “Month” column from a “Date” column. Then, we will calculate the average values of the units sold per month.
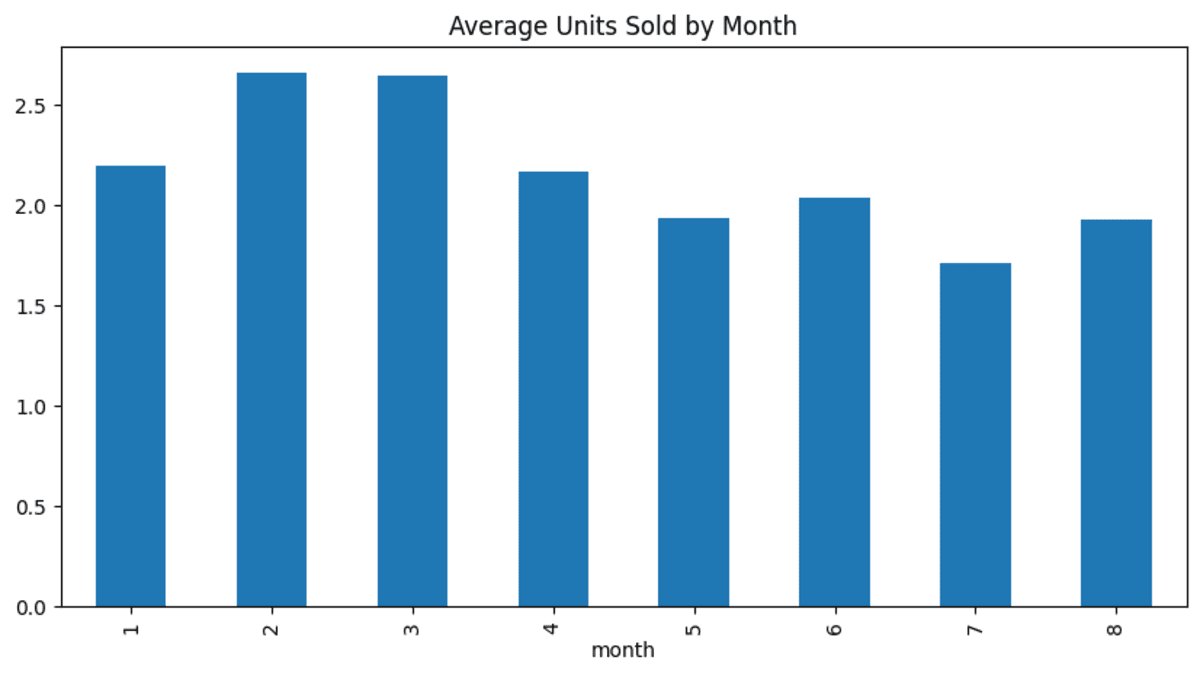
- View the bar chart of the average unit sold per month.
# data cleaning
df = df.drop_duplicates()
df = df.dropna()
df = df.reset_index(drop=True)

# convert types
df('Product Category') = df('Product Category').astype('str')
df('Product Name') = df('Product Name').astype('str')
df('Date') = pd.to_datetime(df('Date'))

# data analysis
df('month') = df('Date').dt.month
new_df = df.groupby('month')('Units Sold').mean()

# data visualization
new_df.plot(kind='bar', figsize=(10, 5), title="Average Units Sold by Month");

This is pretty simple, and if you are a data scientist or even a data science student, you will know how to perform most of these tasks.
Building Data Science Pipelines with Pandas Pipe
To create an end-to-end data science workflow, we first need to convert the above code into a suitable format using Python functions.
We will create Python functions for:
- Loading data: Requires a CSV file directory.
- Data cleansing: Requires a raw DataFrame and returns the cleaned DataFrame.
- Convert column types: Requires a DataFrame and clean data types and returns the DataFrame with the correct data types.
- Data analysis: Requires a DataFrame from the previous step and returns the modified DataFrame with two columns.
- Data visualization: Requires a modified DataFrame and a visualization type to generate the visualization.
def load_data(path):
    return pd.read_csv(path)

def data_cleaning(data):
    data = data.drop_duplicates()
    data = data.dropna()
    data = data.reset_index(drop=True)
    return data

def convert_dtypes(data, types_dict=None):
    data = data.astype(dtype=types_dict)
    ## convert the date column to datetime
    data('Date') = pd.to_datetime(data('Date'))
    return data


def data_analysis(data):
    data('month') = data('Date').dt.month
    new_df = data.groupby('month')('Units Sold').mean()
    return new_df

def data_visualization(new_df,vis_type="bar"):
    new_df.plot(kind=vis_type, figsize=(10, 5), title="Average Units Sold by Month")
    return new_df
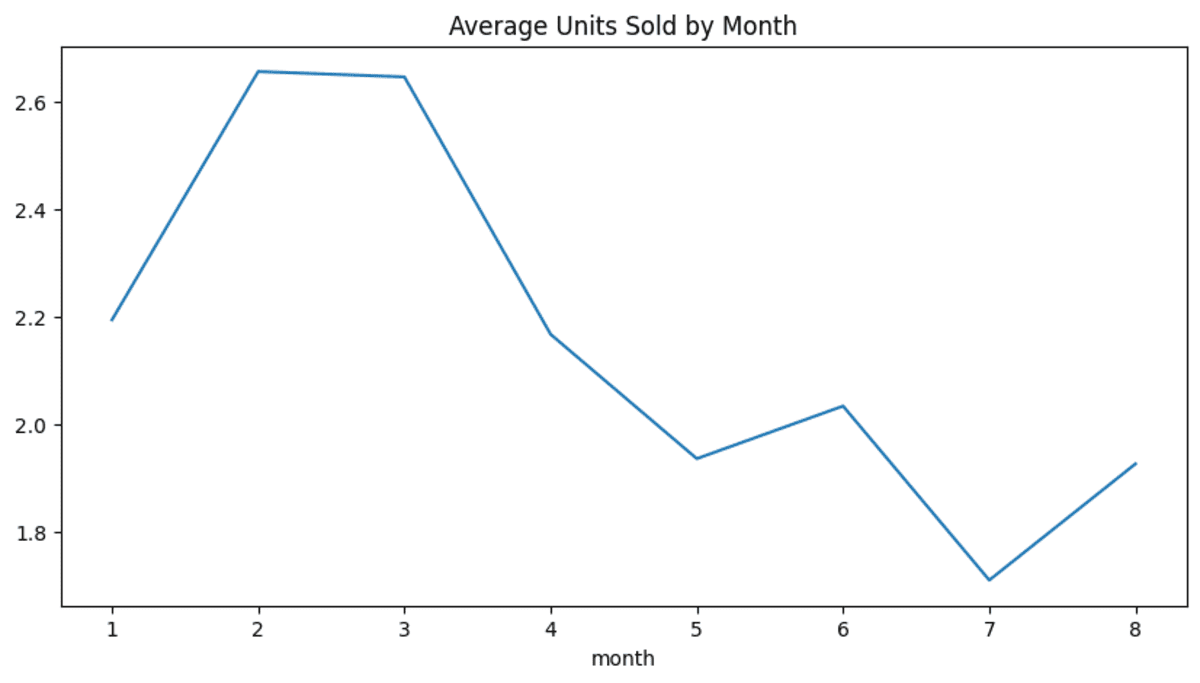
Now we will use the `pipe` method to serially chain together all the above Python functions. As we can see, we have provided the file path to the `load_data` function, the data types to the `convert_dtypes` function, and the visualization type to the `data_visualization` function. Instead of a bar, we will use a line chart for visualization.
Creating data pipelines allows us to experiment with different scenarios without changing the overall code. We are standardizing the code and making it more readable.
path = "/work/Online Sales Data.csv"
df = (pd.DataFrame()
            .pipe(lambda x: load_data(path))
            .pipe(data_cleaning)
            .pipe(convert_dtypes,{'Product Category': 'str', 'Product Name': 'str'})
            .pipe(data_analysis)
            .pipe(data_visualization,'line')
           )
The final result looks impressive.


Conclusion
In this short tutorial, we learned about Pandas' `pipe` method and how to use it to create and run end-to-end data science pipelines. Pipelining makes your code more readable, reproducible, and better organized. By integrating the pipe method into your workflow, you can streamline your data processing tasks and improve the overall efficiency of your projects. Additionally, some users have found that using `pipe` instead of the `.apply()` method results in significantly faster execution times.
Abid Ali Awan (@1abidaliawan) is a certified data scientist who loves building machine learning models. Currently, he focuses on content creation and writing technical blogs on machine learning and data science technologies. Abid holds a Master's degree in technology Management and a Bachelor's degree in Telecommunication Engineering. His vision is to create an ai product using a graph neural network for students struggling with mental illness.
 NEWSLETTER


