NEWSLETTER

Visualizing Data with Pie Charts in Matplotlib | by Diana Rozenshteyn | October 2024
Examples of how to create different types of pie charts using Matplotlib to visualize database analysis results in a Jupyter ...
Examples of how to create different types of pie charts using Matplotlib to visualize database analysis results in a Jupyter ...
Introduction Gender detection from facial images is one of the many fascinating applications of computer vision. In this project, we ...
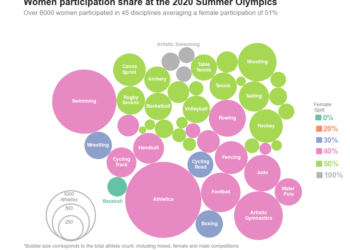
For my graph, I'm using a historical Olympic dataset from Olympedia.org that Joseph Cheng shared on Kaggle licensed under a ...

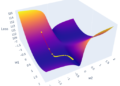
Introduction This post provides a complete tutorial on using Matplotlib, a powerful Python data visualization tool, to create and modify ...

Introduction Pie charts, a widely used visualization tool, represent proportions of data in a circular format. Each sector corresponds to ...

Introduction This article delves into the intricate art of data visualization and demystifies the process of creating, customizing, and interpreting ...

Fast Win Data ScienceThere's a reason you're confusedImage by Cederic Vandenberghe on UnsplashAre you having problems with Matplotlib? If you're ...