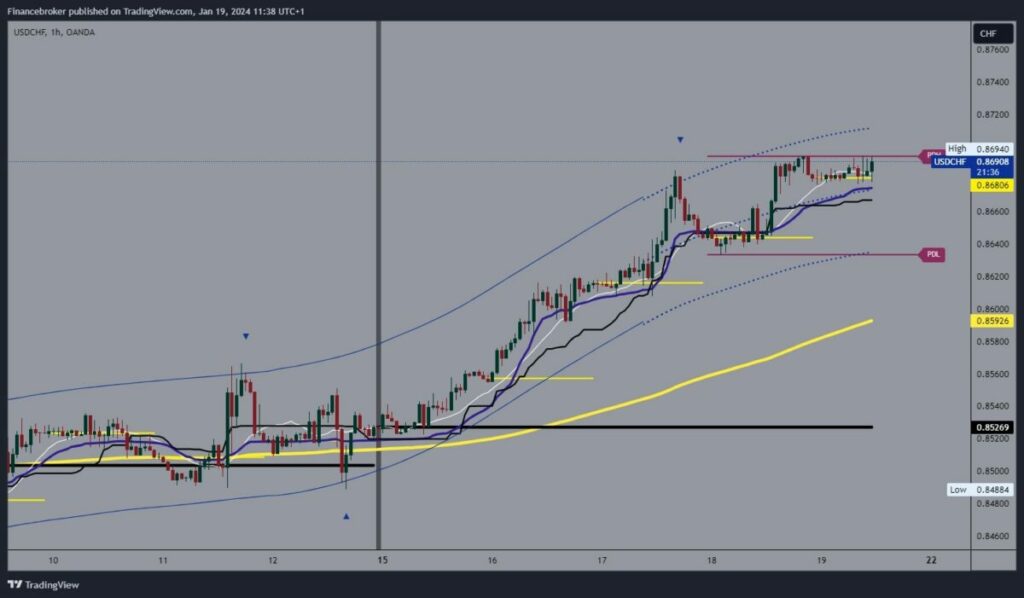
- This week we have seen a bullish consolidation of USDCHF from 0.85250 to 0.86940.
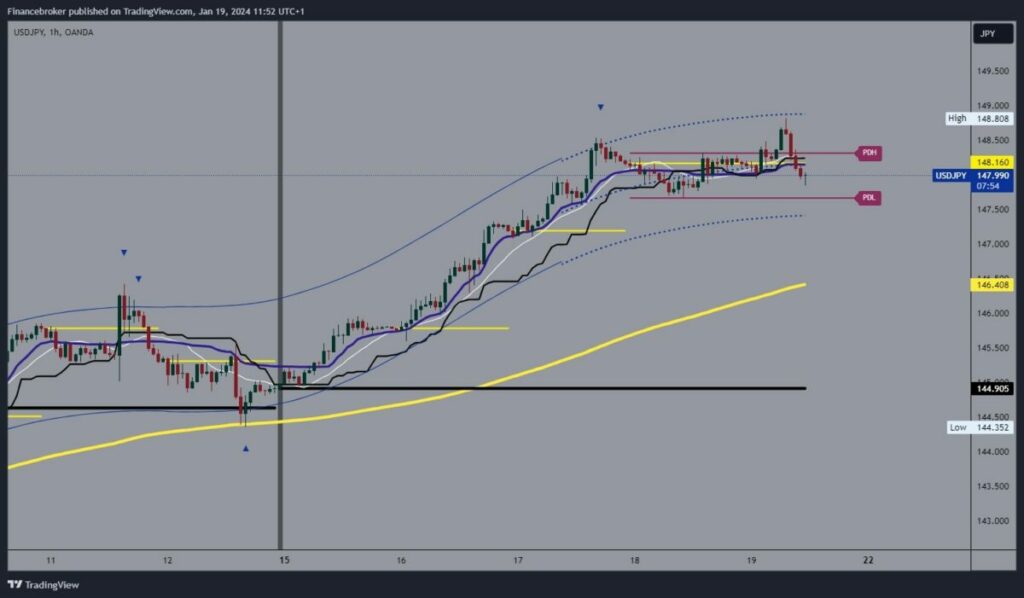
- USDJPY was strongly bullish this week, from 144.90 to 148.80 levels.
USDCHF chart analysis
This week we have seen a bullish consolidation of USDCHF from 0.85250 to 0.86940. During the Asian session, the pair managed to hold above the 0.86800 level and now we see fresh momentum that could surpass the 0.87000 level. The possible highest targets are the 0.87200 and 0.87400 levels.
We need a pullback below the 0.86800 support level for a bearish option. After that, we entered a zone that could strengthen the bearish momentum and send us to yesterday's support zone around 0.86400. A break below would mean that the dollar is weakening and USDCHF could decline further. The lowest possible targets are the 0.86200 and 0.86000 levels. The moving average EMA200 is located in the zone around the level 0.86000.

USDJPY chart analysis
USDJPY was strongly bullish this week, from 144.90 to 148.80 levels. The mentioned high was formed this morning during the Asian session. After that, we see the pair stop there and start to retrace towards the 148.00 level. Here we could get new support and start a bullish consolidation with the aim of breaking the previous high. The highest potential targets are the 149.00 and 149.50 levels.
For a bearish option, we need a pullback to the support at 147.50. A drop below this level could trigger a deeper pullback and start a downtrend. The lowest possible targets are the levels 147.00 and 146.50. The EMA200 is a potential support for us in the area around 146.50 levels.

!function(f,b,e,v,n,t,s){if(f.fbq)return;n=f.fbq=function(){n.callMethod?n.callMethod.apply(n,arguments):n.queue.push(arguments)};if(!f._fbq)f._fbq=n;n.push=n;n.loaded=!0;n.version=’2.0′;n.queue=();t=b.createElement(e);t.async=!0;t.src=v;s=b.getElementsByTagName(e)(0);s.parentNode.insertBefore(t,s)}(window,document,’script’,’https://connect.facebook.net/en_US/fbevents.js’);fbq(‘init’,’504526293689977′);fbq(‘track’,’PageView’)
 NEWSLETTER


