Super Micro Computer (SMCI) saw a strong rally this week following its announcement of a compliance plan submitted to the SEC to prevent its delisting from the Nasdaq. Shares rose 16% during regular trading on Monday and an additional 25% in after-hours trading after the presentation. This positive momentum reflects renewed investor confidence in the company's ability to address regulatory concerns.
The compliance plan outlines a clear path for the submission of late filings and demonstrates progress toward alignment with Nasdaq requirements. If approved, the plan could stabilize SMCI shares, which have been under significant pressure, falling 65% in the past three months. This drop came after a year of explosive growth, in which the stock gained more than 300% before retreating. Despite the recent rally, SMCI is down more than 20% so far in 2024.
From a technical perspective, the stock's recent price action suggests a possible reversal of its downtrend. The large volume that accompanied Monday's rally indicates strong buying interest. Immediate support is seen near $20, while resistance lies at $25.
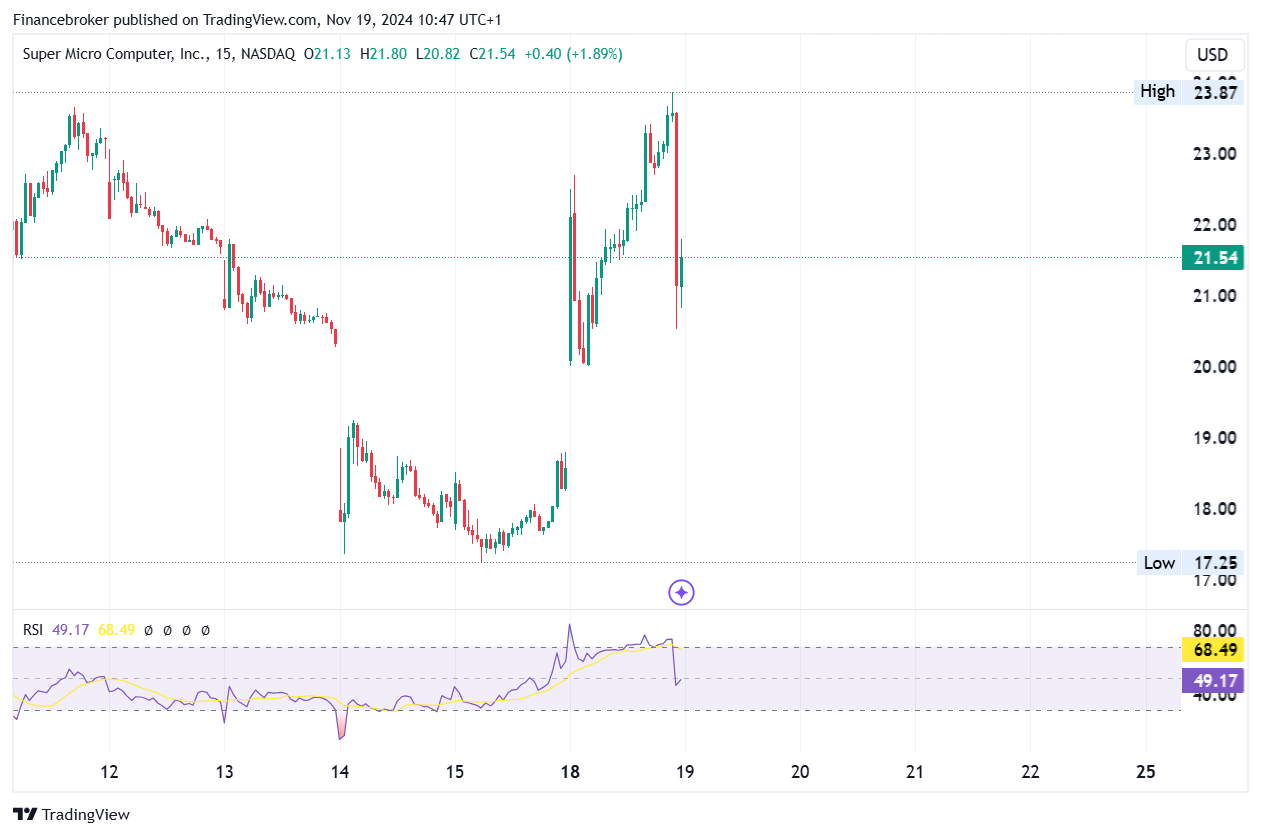
Super Micro Computer Stock Chart Analysis

The chart shows the 15-minute price movement of Super Micro Computer, Inc. (SMCI) on NASDAQ. The stock is currently trading at $21.54, reflecting a gain of 1.89% on the session. After a period of consolidation, the stock showed strong bullish momentum, moving from the support level of $17.25 to an intraday high of $23.87, a major bullish move. However, a sharp pullback occurred and prices retreated to the 21.50 range, indicating possible profit-taking or resistance at higher levels.
The RSI (Relative Strength Index) rose, reaching 68.49, approaching overbought territory during the rally. This suggests strong buying pressure, but also indicates caution, as the stock may face increased volatility or a possible correction if it maintains overbought levels. Currently, the RSI has cooled slightly, reflecting the recent pullback.
From a technical perspective, immediate support is around $20.50, near the lower consolidation zone from earlier in the session. A break below this level could signal a further decline towards $19.00. On the upside, resistance is evident at the intraday high of $23.87. A decisive break above this level, accompanied by strong volume, could indicate the potential for continued bullish momentum.
In summary, SMCI's current price action suggests a volatile but bullish trend. Traders should monitor RSI levels and price action around key support and resistance levels to evaluate short-term opportunities.
!function (f, b, e, v, n, t, s) {
if (f.fbq) return;
n = f.fbq = function () {
n.callMethod ?
n.callMethod.apply(n, arguments) : n.queue.push(arguments)
};
if (!f._fbq) f._fbq = n;
n.push = n;
n.loaded = !0;
n.version = ‘2.0’;
n.queue = ();
t = b.createElement(e);
t.async = !0;
t.src = v;
s = b.getElementsByTagName(e)(0);
s.parentNode.insertBefore(t, s)
}(window, document, ‘script’,
‘https://connect.facebook.net/en_US/fbevents.js’);
fbq(‘init’, ‘504526293689977’);
fbq(‘track’, ‘PageView’);
 NEWSLETTER


