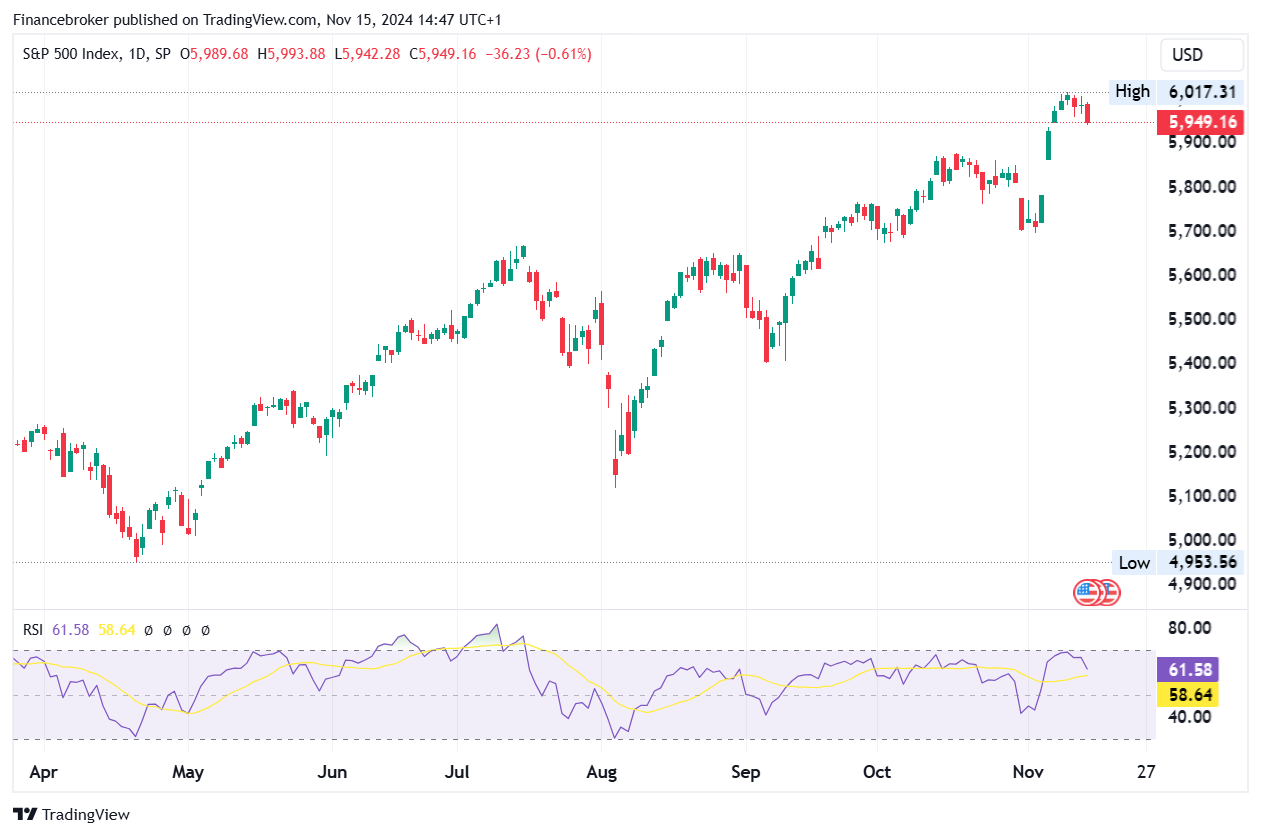
U.S. stock futures fell early Friday as the post-election rally showed signs of faltering and the Federal Reserve signaled a cautious stance on further interest rate cuts. Dow Jones Industrial Average futures fell 156 points, or 0.36%, while S&P 500 and Nasdaq 100 futures fell 0.51% and 0.76%, respectively.
technology stocks had mixed fortunes, with chip equipment maker Applied Materials falling more than 8% after issuing weak revenue guidance for the current quarter. By contrast, Domino's Pizza rose more than 7% following news that Berkshire Hathaway had acquired a stake in the company, indicating investor confidence in the fast food giant.
This follows a negative session on Thursday, where the Dow Jones lost more than 200 points and both the S&P 500 and Nasdaq Composite fell about 0.6%. Major indices are poised to close the week lower, eroding last week's post-election gains boosted by Donald Trump's victory. Notably, the Nasdaq Composite has fallen 0.9% this week, while the S&P 500 and Dow have fallen 0.8% and 0.5%, respectively.
Despite the broader market pullback, the Dow Jones reached a milestone earlier in the week, closing above 44,000 for the first time. However, concerns about the Federal Reserve's dovish approach to monetary easing and mixed corporate earnings have tempered investor optimism. This underscores the fragile nature of the recent rebound amid evolving economic and political uncertainties.
Technical analysis of the S&P 500

The 15-minute chart of the S&P 500 Index (SPX) is showing a bearish trend over the past few sessions, with a steady decline from previous highs around 6,017.31 to the current level near 5,949.16. The pattern indicates selling pressure as the index struggles to contain any attempted rebound, suggesting weak investor sentiment in the near term.
The Relative Strength Index (RSI) is at 36.93, below the neutral mark of 50 and approaching oversold territory (30 or below). This level typically indicates that selling momentum may be about to run out, but does not confirm a reversal without further evidence. The downtrend of the RSI suggests that the bears are still in control, although a reversal could be on the horizon if the index falls further and the RSI enters oversold conditions.
Key support is seen near 5,930, a level tested several times during the chart period. A break below this level could trigger further downward pressure. On the other hand, if the S&P 500 rebounds, it could face resistance around 5,980. For now, the technical data suggests caution as the index may continue its downward trend unless it finds strong support or positive momentum to change course.
!function (f, b, e, v, n, t, s) {
if (f.fbq) return;
n = f.fbq = function () {
n.callMethod ?
n.callMethod.apply(n, arguments) : n.queue.push(arguments)
};
if (!f._fbq) f._fbq = n;
n.push = n;
n.loaded = !0;
n.version = ‘2.0’;
n.queue = ();
t = b.createElement(e);
t.async = !0;
t.src = v;
s = b.getElementsByTagName(e)(0);
s.parentNode.insertBefore(t, s)
}(window, document, ‘script’,
‘https://connect.facebook.net/en_US/fbevents.js’);
fbq(‘init’, ‘504526293689977’);
fbq(‘track’, ‘PageView’);


