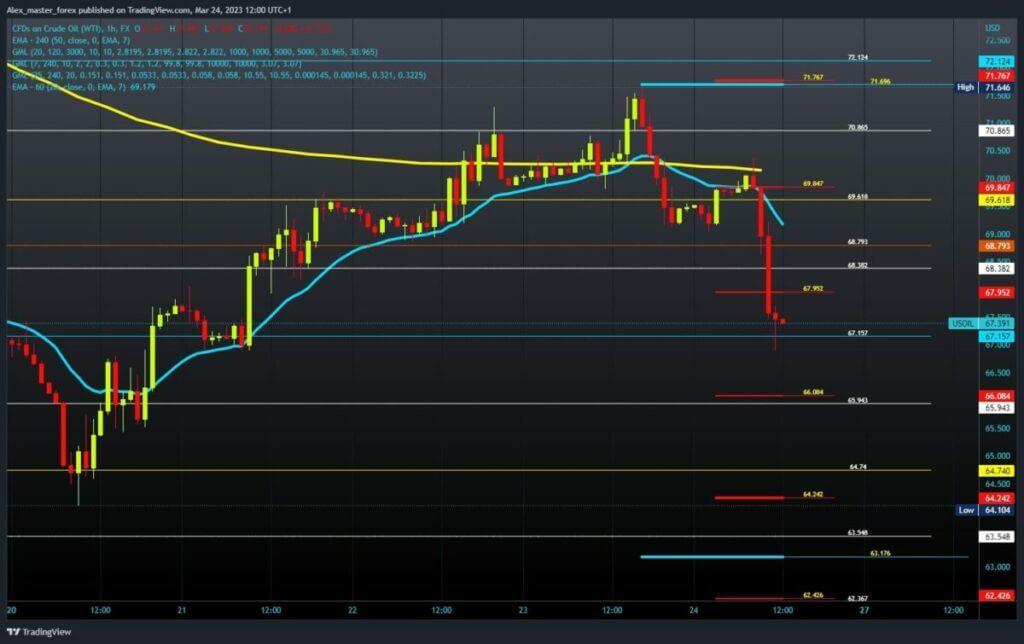
- During the Asian trading session, the oil price managed to hold around the $70.00 level.
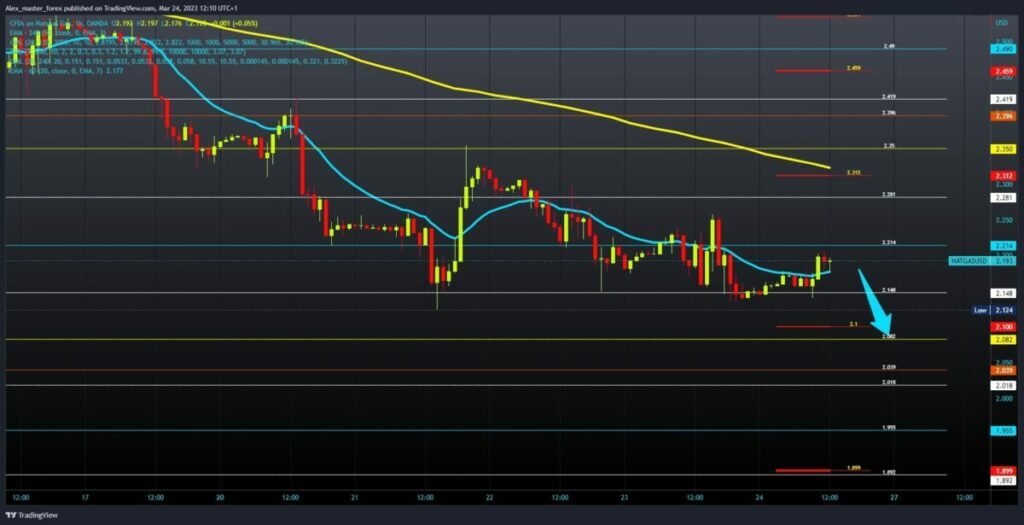
- During the Asian trading session, the price of natural gas held above the 2.15 level.
Oil chart analysis
During the Asian trading session, the oil price managed to hold around the $70.00 level. At the beginning of the European session, there was instability on the oil chart and the price began to fall. It was stopped at the $66.90 level, and pulled back above the $67.00 level.
For now, the price manages to stay above that level and we need a positive consolidation to activate a new bullish option. We need negative consolidation and a further drop below the $67.00 level for a bearish option. After that, a gap would open up and the price could drop towards the $66.00 level.

Natural Gas Chart Analysis
During the Asian trading session, the price of natural gas held above the 2.15 level. The price took advantage of that and increased to $2.20. For now, we have resistance at that level, but if the current consolidation continues, we could see a break above and continued price growth.
The highest potential targets are the $2.25 and $2.30 levels. For a bearish option, we need negative consolidation and a drop to $2.15 from this morning’s support. A price break below would lead to the formation of a new lower low, and that would mean a further pullback in the price of gas. The lowest possible targets are the $2.10 and $2.00 levels.

BONUS VIDEO: Weekly summary of market news
(embed)https://www.youtube.com/watch?v=vkqXF4W_wuM(/embed)
!function (f, b, e, v, n, t, s) {
if (f.fbq) return;
n = f.fbq = function () {
n.callMethod ?
n.callMethod.apply(n, arguments) : n.queue.push(arguments)
};
if (!f._fbq) f._fbq = n;
n.push = n;
n.loaded = !0;
n.version = ‘2.0’;
n.queue = ();
t = b.createElement(e);
t.async = !0;
t.src = v;
s = b.getElementsByTagName(e)(0);
s.parentNode.insertBefore(t, s)
}(window, document, ‘script’,
‘https://connect.facebook.net/en_US/fbevents.js’);
fbq(‘init’, ‘504526293689977’);
fbq(‘track’, ‘PageView’);
 NEWSLETTER


