Shares of Kohl's Corporation (NYSE:KSS) plunged 11% following a disappointing third-quarter earnings report and a sharp downgrade of its outlook for fiscal 2024. The department store chain reported adjusted earnings per share of 0. $20, significantly below analyst expectations of $0.31. Revenue declined 8.8% year over year to $3.51 billion, missing the consensus estimate of $3.65 billion, while comparable sales fell 9.3%, reflecting continued weakness in its main categories of clothing and footwear.
In response to the challenging environment, Kohl's cut its full-year profit forecast. The new range is $1.20 to $1.50 per share. This is a marked reduction from his previous outlook. It is also below the Wall Street consensus of $1.86. The company now expects full-year net sales to decline 7% to 8%. Comparable sales are expected to fall 6% to 7%. This indicates that there will be more headwinds in the coming months.
CEO Tom Kingsbury acknowledged difficulties in key categories, but highlighted growth in segments such as Sephora and home decor. However, these gains were insufficient to offset the broader declines. On a positive note, gross margin improved slightly, increasing 20 basis points to 39.1%, and inventory levels decreased 3% year over year.
Kohl's faces increasing challenges. Weak consumer demand is weighing
Kohl's Stock Chart Analysis

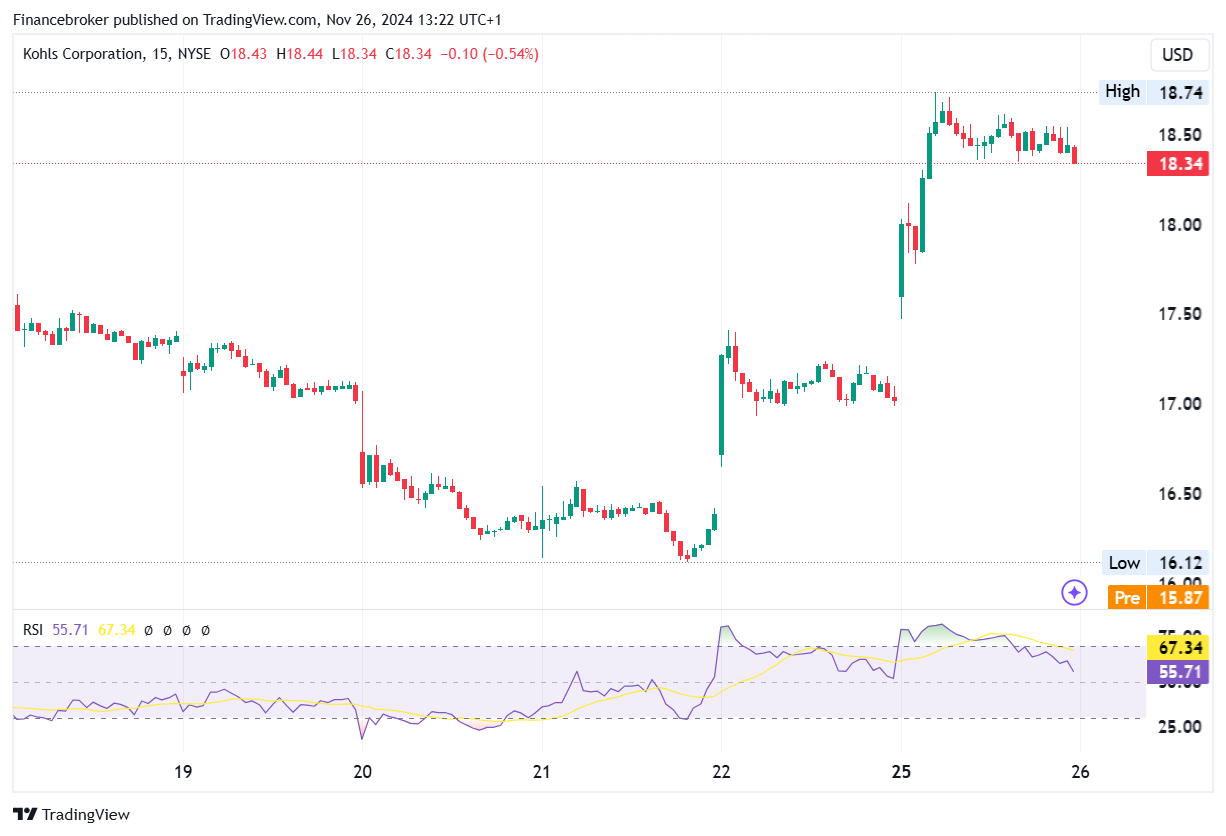
KSS/USD 15-minute chart
The 15-minute chart of Kohl's Corporation (NYSE: KSS) demonstrates major swings in momentum and price action over the past few sessions. After a prolonged downtrend, the stock bottomed near $16.12 on the 20th before experiencing a strong bullish reversal. A strong green candle on the 22nd indicates strong buying interest, pushing the price above $18.
The RSI (Relative Strength Index) initially showed oversold conditions below 30 before recovering, peaking above 70, indicating overbought territory during the recent rally. Currently, the RSI is at 55.71, suggesting neutral momentum but leaning towards consolidation. The price now sits around $18.34, reflecting a slight pullback after reaching a session high of $18.74.
Resistance appears to be near $18.50 – $18.75 as the price struggles to maintain bullish momentum. Support levels can be seen between $17.00 and $17.50, offering potential entry points if a pullback occurs. The recent price breakout and volume spikes suggest a near-term bullish bias, although continued strength depends on holding above $18.
Traders should monitor RSI divergence and volume patterns to confirm a possible uptrend continuation or reversal. A break above $18.75 could pave the way for higher highs, while failure to hold $18 could signal a correction towards key support zones.
!function (f, b, e, v, n, t, s) {
if (f.fbq) return;
n = f.fbq = function () {
n.callMethod ?
n.callMethod.apply(n, arguments) : n.queue.push(arguments)
};
if (!f._fbq) f._fbq = n;
n.push = n;
n.loaded = !0;
n.version = ‘2.0’;
n.queue = ();
t = b.createElement(e);
t.async = !0;
t.src = v;
s = b.getElementsByTagName(e)(0);
s.parentNode.insertBefore(t, s)
}(window, document, ‘script’,
‘https://connect.facebook.net/en_US/fbevents.js’);
fbq(‘init’, ‘504526293689977’);
fbq(‘track’, ‘PageView’);


