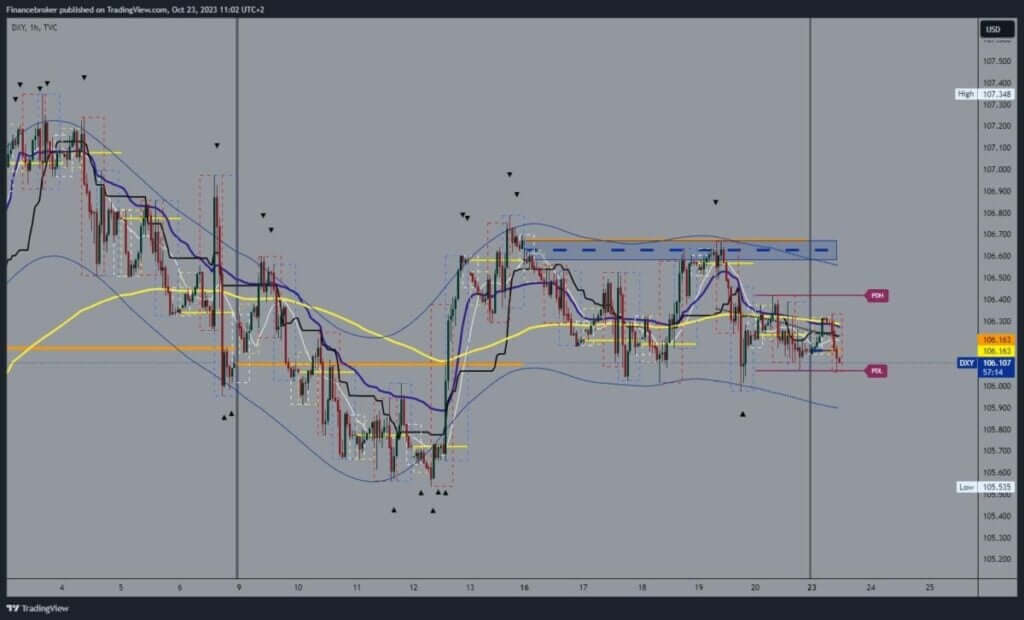
- Earlier this week, the dollar index turned bullish to 106.30.
Dollar Index Chart Analysis
Earlier this week, the dollar index turned bullish to 106.30. There it finds resistance and we return to the initial level of the market opening. The additional pressure in that area creates the EMA50 market average. The pressure is moving towards the 106.10 level, which could influence us to go down to 106.00 to test that area. Last week the dollar moved in the range 106.00-106.70 and managed to stay above the support zone.
We are now back in that area, so fresh pressure and a break below could be expected. The lowest possible targets are the 105.90 and 105.80 levels. We need a positive consolidation and a jump to the 106.40 level for a bullish option. Therefore, we would jump the support at 106.30 and form a new high today. We would also get support at the EMA50 moving average and could test Friday’s high.

View of the dollar above the level 106.70
A break above would be a sign that the dollar has the strength to continue to the 106.70 level and test last week’s resistance there. The highest potential targets are the 106.80 and 106.90 levels. The dollar would then have a new opportunity to test the early October resistance zone above the 107.20 level.
Today we have no major economic news that could shake the dollar chart. Wednesday and Thursday will be interesting as we will have interest rate decisions from the Bank of Canada and the ECB. At that time, we can expect larger movements in all major currency pairs.
ADDITIONAL VIDEO: Weekly summary of market news
!function(f,b,e,v,n,t,s){if(f.fbq)return;n=f.fbq=function(){n.callMethod?n.callMethod.apply(n,arguments):n.queue.push(arguments)};if(!f._fbq)f._fbq=n;n.push=n;n.loaded=!0;n.version=’2.0′;n.queue=();t=b.createElement(e);t.async=!0;t.src=v;s=b.getElementsByTagName(e)(0);s.parentNode.insertBefore(t,s)}(window,document,’script’,’https://connect.facebook.net/en_US/fbevents.js’);fbq(‘init’,’504526293689977′);fbq(‘track’,’PageView’)
 NEWSLETTER


