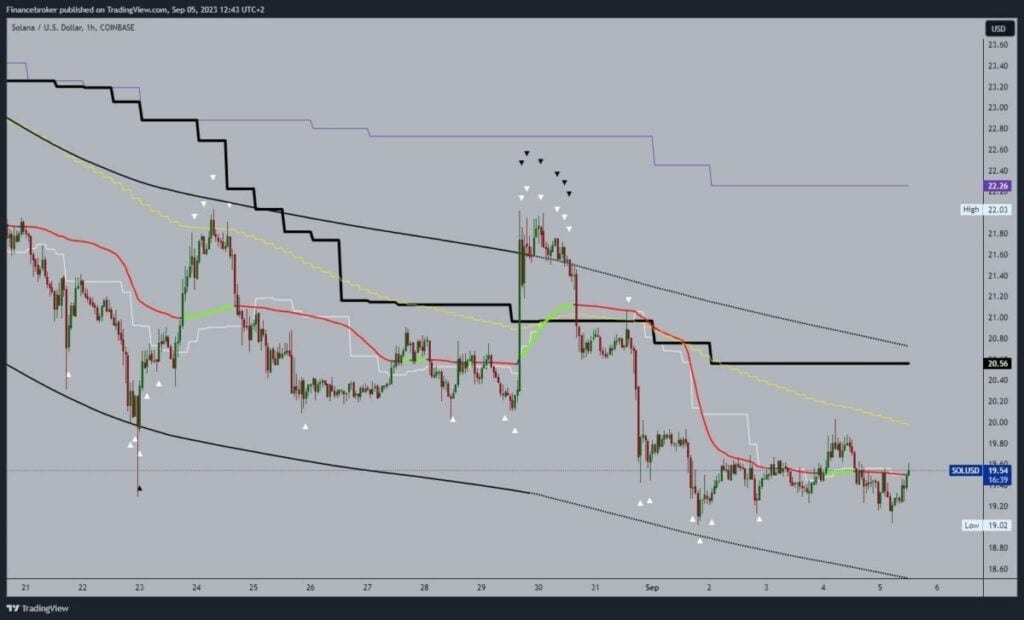
- The price of Solana has been in the range of 19.00-19.80 for the third day.
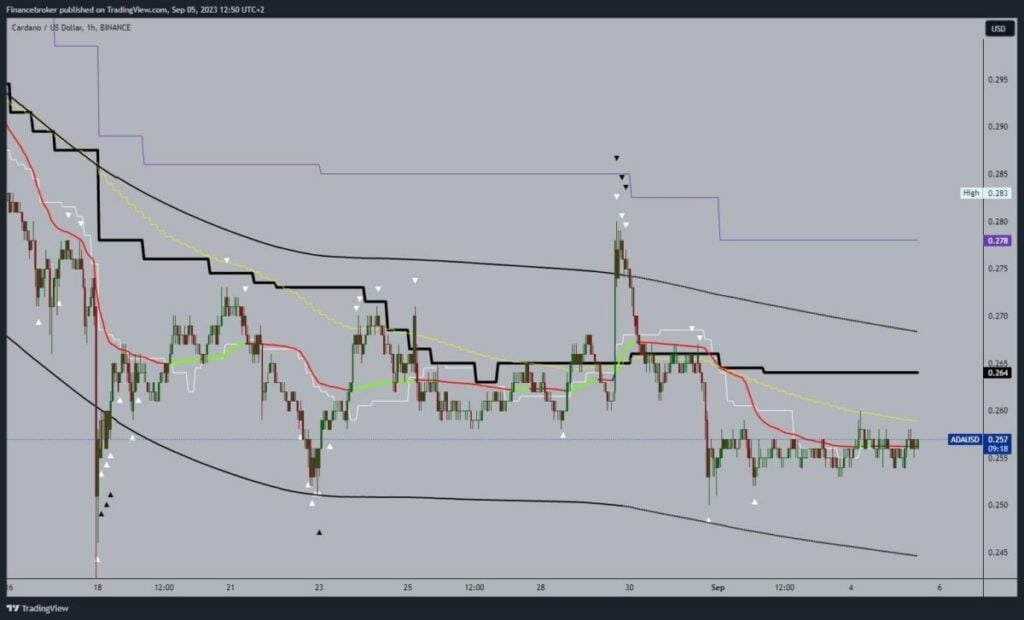
- The price of Cardano has continued its sideways consolidation since the beginning of the month.
Solana chart analysis
The price of Solana has been in the range of 19.00-19.80 for the third day. This morning, we retested the support at the 19.00 level and managed to initiate a new bullish consolidation. Now, we are at the 19.55 level, and we need to maintain this level in order to start further recovery from there. Potential higher targets are 19.80 and 20.00 levels. Additional resistance in the zone around 20.00 is the EMA50 moving average.
We need a negative consolidation and a new pullback to the 19.00 level for a bearish option. A break below this level would lead to the formation of a new low, which would confirm the bearish trend. Potential lower targets are 18.80 and 18.60 levels.

Cardano chart analysis
The price of Cardano has continued its sideways consolidation since the beginning of the month. We are still moving in the 0.250-0.260 range, with slight pressure on the upper resistance line. Additional resistance at the 0.260 level is in the EMA50 moving average. A break above is a sign that Cardano’s price has the strength to make a bigger recovery. Potential higher targets are 0.265 and 0.270 levels.
We need a negative consolidation and pullback to the 0.250 support level for a bearish option. Below 0.260, we remain under the pressure of the EMA50 moving average, which in that case, is on the bearish side. A fall below it would strengthen the bearish option, which would lead to the formation of a new low and confirmation of the bearish scenario. Potential lower targets are the 0.245 and 0.240 levels.

BONUS VIDEO: Weekly news summary from the markets
(embed)https://www.youtube.com/watch?v=ilWhYn7tdxY(/embed)


