 NEWSLETTER
ethereum price has failed to rise back above the $4,000 level and is currently falling. While the market is correcting at the moment, a bullish bounce is still possible in the near future.
Technical analysis
The daily chart
On the daily chart, the price was rejected from the $4,000 level in March and is yet to recover. The market has also failed to recover the $3,500 level and has been rejected lower from this area.
Currently, the $3,000 support level looks like a likely target as the Relative Strength Index has also fallen below 50%. However, the uptrend may not be over yet as the price is still trading above the 200-day moving average.
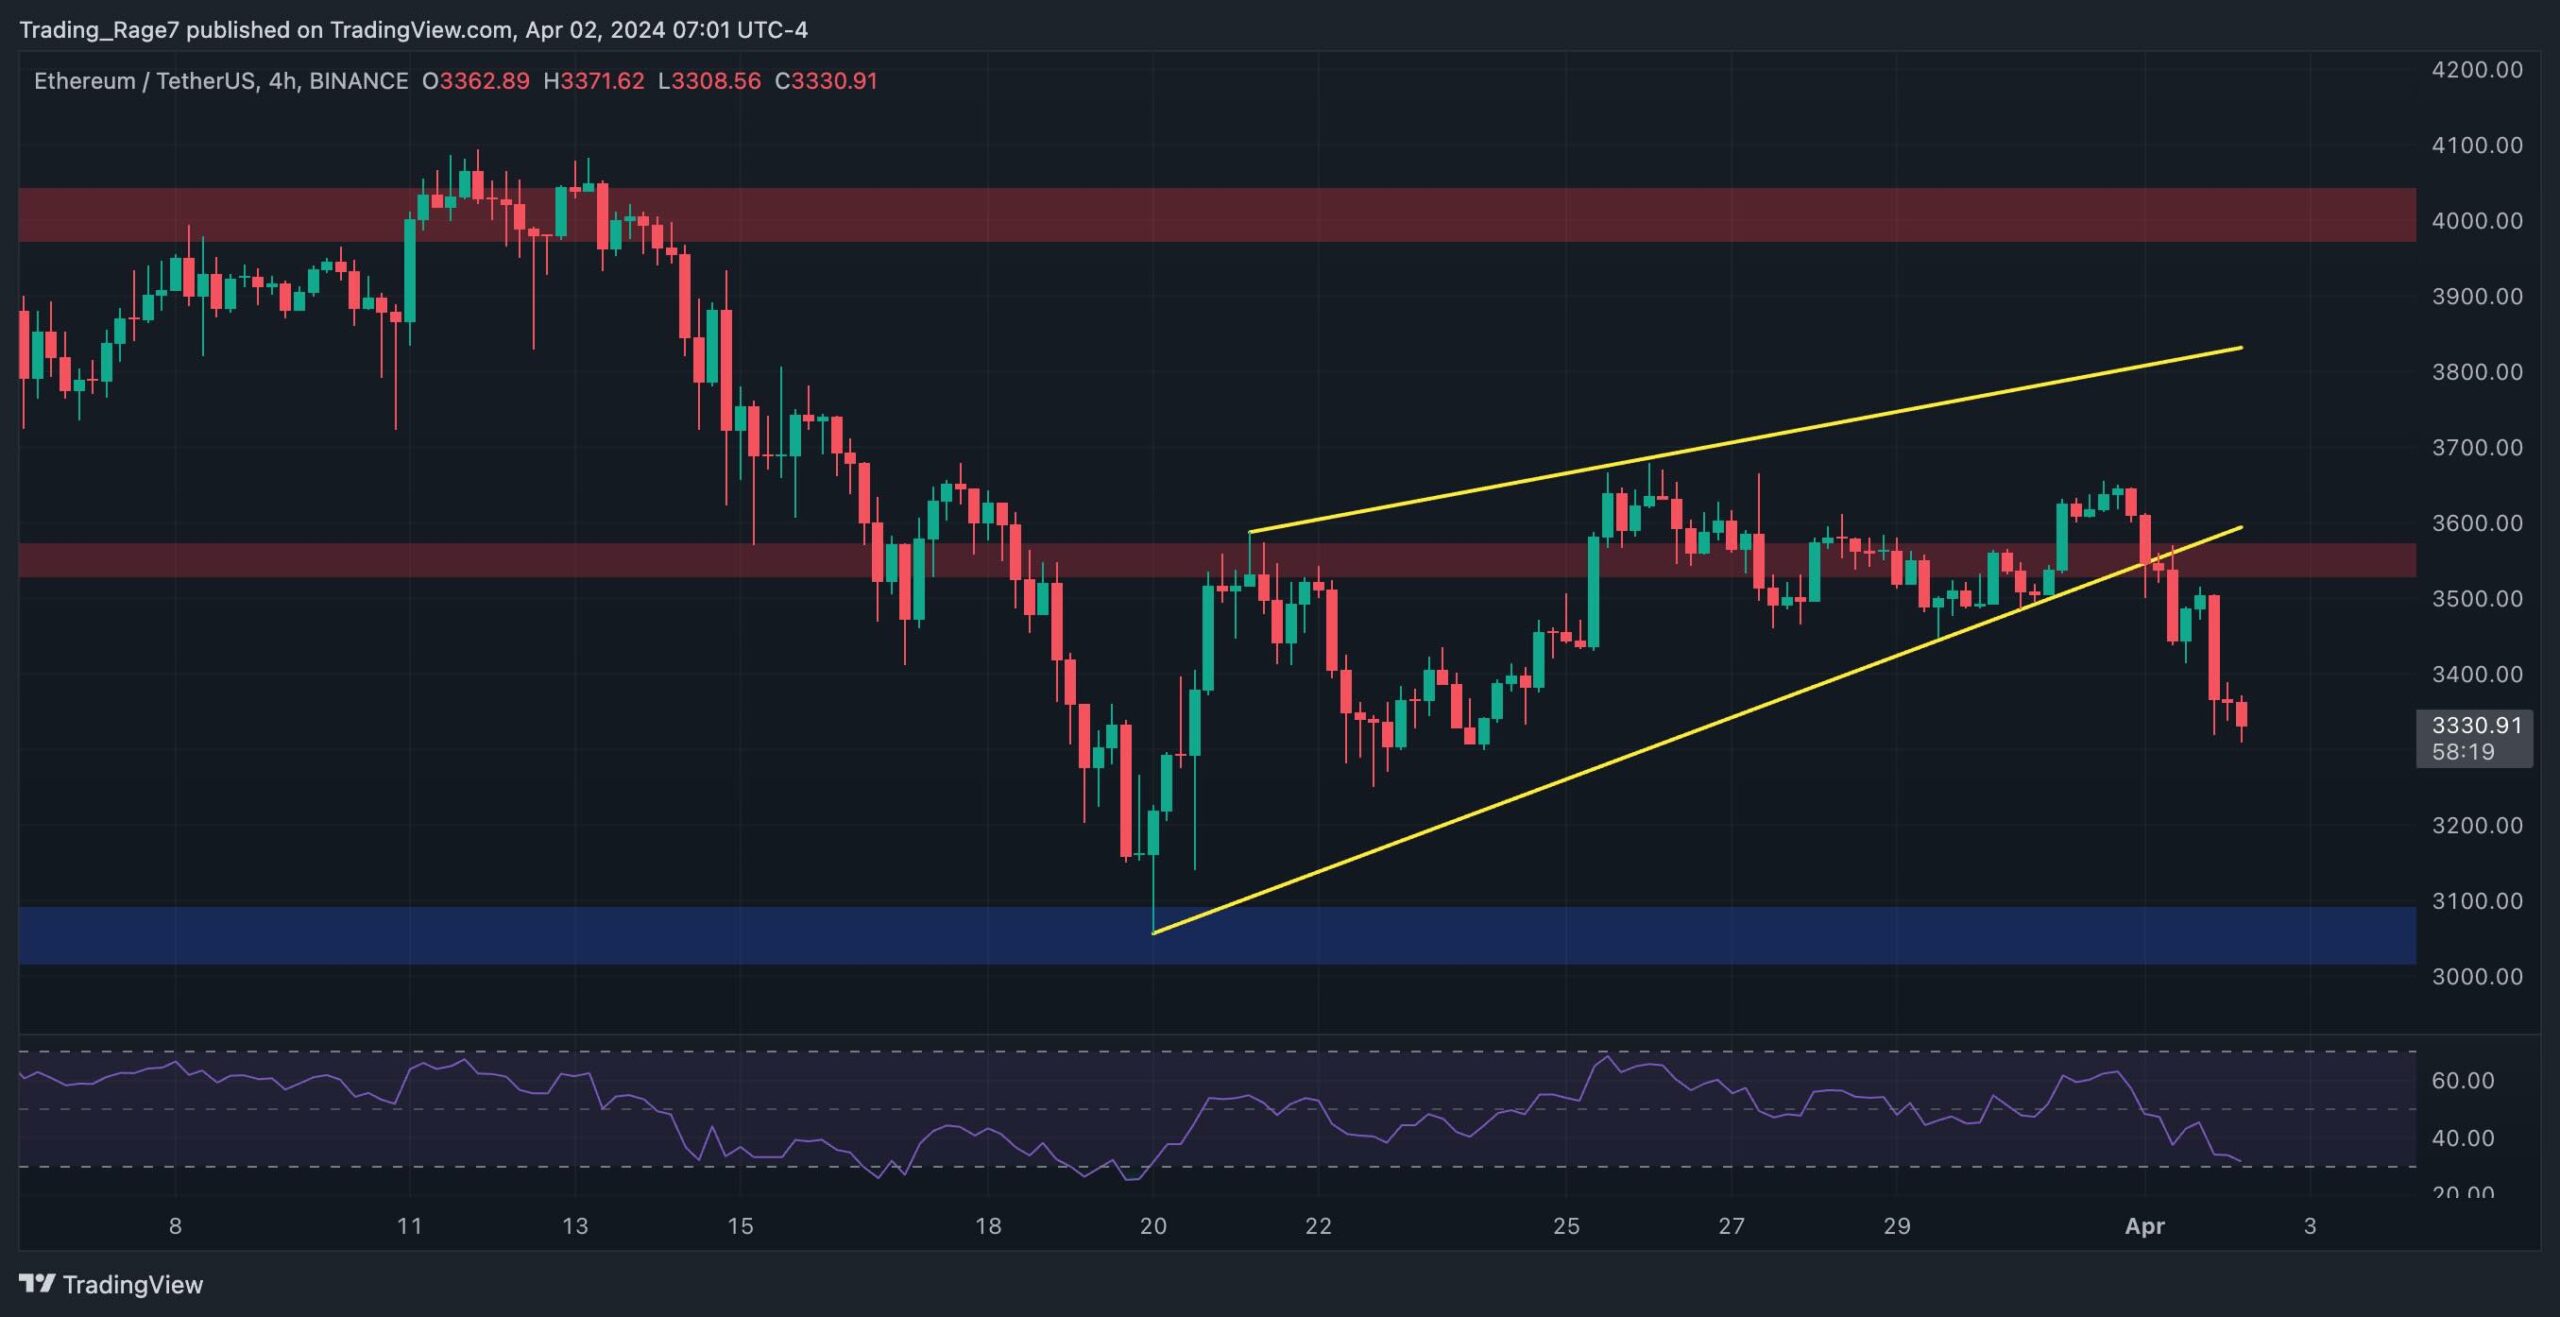
The 4 hour chart
Looking at the 4-hour chart, the recent market consolidation seems clearer. The price created a rising wedge and broke it to the downside, which is a classic bearish continuation pattern.
As eth approaches the $3,000 support level, the RSI is falling below the 30% mark, indicating that eth is oversold in this time frame. Therefore, it could only be a matter of time before the price rebounds higher, probably from the $3,000 support zone.
Chain analysis
ethereum Funding Rates
ethereum price has been falling below $4,000 recently, failing to continue its bullish momentum. One possible reason for the recent decline could be extreme investor optimism.
This graph demonstrates the funding rate metric. They indicate whether buyers or sellers are executing their orders more aggressively overall. Positive values support bullish sentiment, while negative values show bearish sentiment, which typically shows a state of fear in the market.
As the chart shows, funding rates have been extremely high recently. This could have led to a long cascade of liquidations, which in turn has resulted in a drop below the $4,000 level. As long as funding rates remain high and the futures market is therefore overheated, a sustainable rally is unlikely.
The post ethereum Price Analysis: Will $3,000 Be Next for eth or Will Bulls Rebound? appeared first on CryptoPotato.


