On-chain data shows that Ethereum’s failed transaction count has skyrocketed recently, a sign that the ETH market may be overheating right now.
The Ethereum network is seeing an increase in transactions currently
As noted by an analyst in a CryptoQuant mailAnytime the coin’s failed transaction count passes the 200,000 mark, it’s usually an indication of overheating in the market.
In periods when the activity of the Ethereum blockchain is high, that is, a large number of transactions are carried out simultaneously, gas fees on the network can increase considerably.
This happens because the network can only handle so many transfers at a time, so the price of gas has to go up if there is too much demand to confirm moves on the blockchain.
During those periods of high gas prices, if investors allocate a low amount of gas to their transactions, the transfer may end up failing if the rates turn out to be lower than what the network requires at that specific time.
The “failed transaction count” is an indicator that measures the total number of such Ethereum transfers that fail. Since the occurrence of failed transactions can be directly related to the demand that the network is seeing at the moment, the value of this indicator can give an idea of the activity on the blockchain.
Now, here’s a graph showing the trend in Ethereum’s failed transaction count over the past few years:
The value of the metric seems to have been been pretty high in recent days | Source: CryptoQuant
As shown in the chart above, the quant has marked a threshold line for Ethereum’s failed transaction count. This level corresponds to 200,000 failed transactions taking place on the blockchain, which means that crossings above this line generally suggest a lot of activity is taking place on the network.
In recent years, whenever the indicator has risen above this mark, the asset price usually reacts by showing some volatility. This makes sense, as a large number of trades can provide the fuel for wild price movements to occur.
Naturally, such an overheated market can see the price go either way, meaning that both rises and falls in the asset are possible with this volatility.
However, on the chart, it is visible that most of the instances where the failed trade count exceeded 200,000 were followed by the price recording a decline.
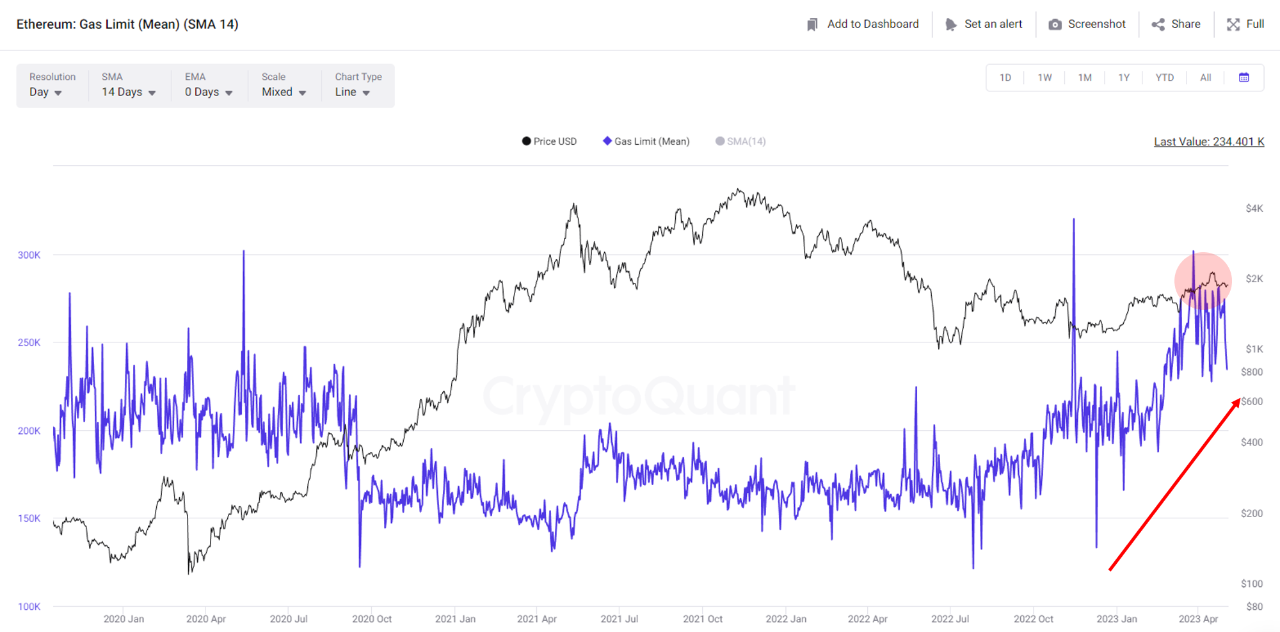
In the past few days, this indicator has risen again, suggesting that blockchain activity is high at the moment. The average gas limit on the network (the maximum amount of gas that the average user chooses) has also increased considerably recently, further evidence of the overheating of the market.

The metric's value has gone up recently | Source: CryptoQuant
The latest spike in interest around meme coins when Pepe Coin (PEPE) burst onto the scene may be one of the factors behind this high blockchain activity.
This overheated market can send the price either way, but given the pattern seen during most of the past, a drop could be the most likely direction.
ETH price
As of this writing, Ethereum is trading around $1,800, down 5% in the past week.
The value of ETH seems to have been moving sideways in the last couple of days | Source: ETHUSD on TradingView
Featured Kanchanara Image on Unsplash.com, Charts from TradingView.com, CryptoQuant.com
 NEWSLETTER


