Ethereum managed to break above the $1,800 price level initially, but has recently been experiencing a period of consolidation. In the last 24 hours, there has not been much progress in the price movement. Similarly, the weekly chart shows that Ethereum has not made significant price gains during this time period.
The technical outlook for ETH is bearish, with signs of declining demand and accumulation. This suggests a lack of enthusiasm from buyers since Ethereum started trading sideways. The altcoin has been consolidating below a major resistance level which, if successfully breached, could pave the way for a possible recovery.
Furthermore, ETH has formed a pattern that suggests the possibility of a bullish breakout in the near future. However, it is important to note that for Ethereum to reverse its downward price trend, it will require broader market support.
Ethereum’s market capitalization has declined, indicating a growing dominance of sellers. This suggests that the selling pressure has been increasing.
Ethereum price analysis: one day chart
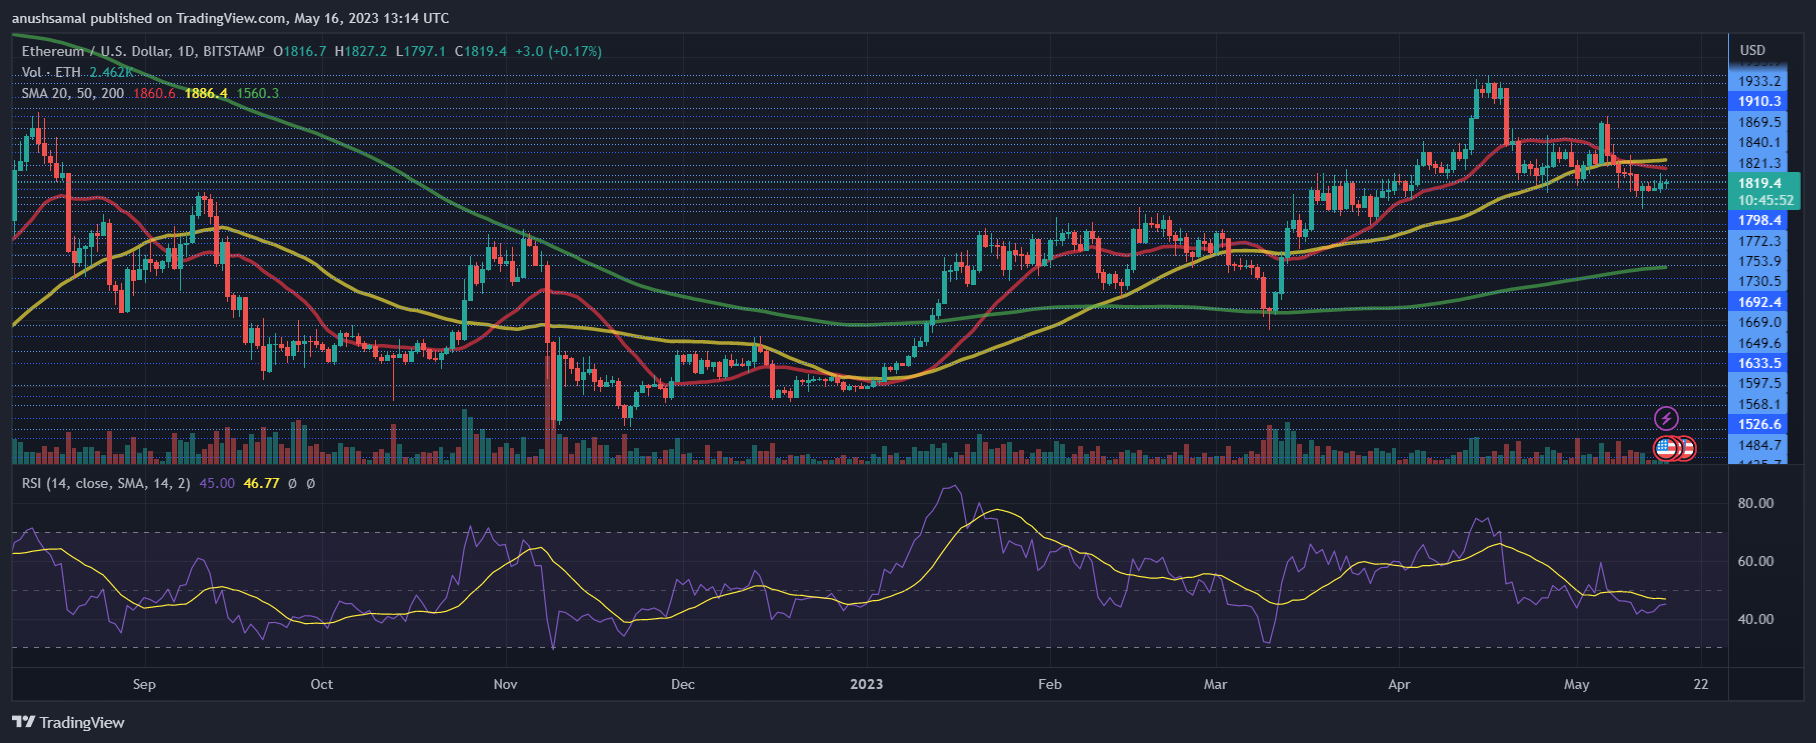
At the time of writing, Ethereum (ETH) was priced at $1,819. After breaching the $1800 resistance level, Ethereum has struggled to maintain a clear price direction. The next significant resistance for the coin is at $1,822, and if this level is breached, there is a chance that Ethereum will attempt to break above $1,840.
ETH is currently showing a falling wedge pattern, which is considered a bullish formation and suggests a possible price reversal in the future. However, if ETH falls from its current level, it could go as high as $1,800 and potentially even drop below $1,790.
Ethereum trading volume in the last session also decreased, indicating a decrease in buying force. But this could also indicate fatigue among sellers.
Technical analysis

The recent price drop has put ETH buyers in a negative zone. The Relative Strength Index (RSI) indicates that sellers currently outnumber buyers as it is below the midline.
Additionally, ETH has dipped below the 20 SMA line, which suggests a lack of demand and signals that sellers are driving market price momentum.
However, if there is a slight increase in demand, it could allow ETH to breach the next resistance level, strengthening the buyers’ position in the market.

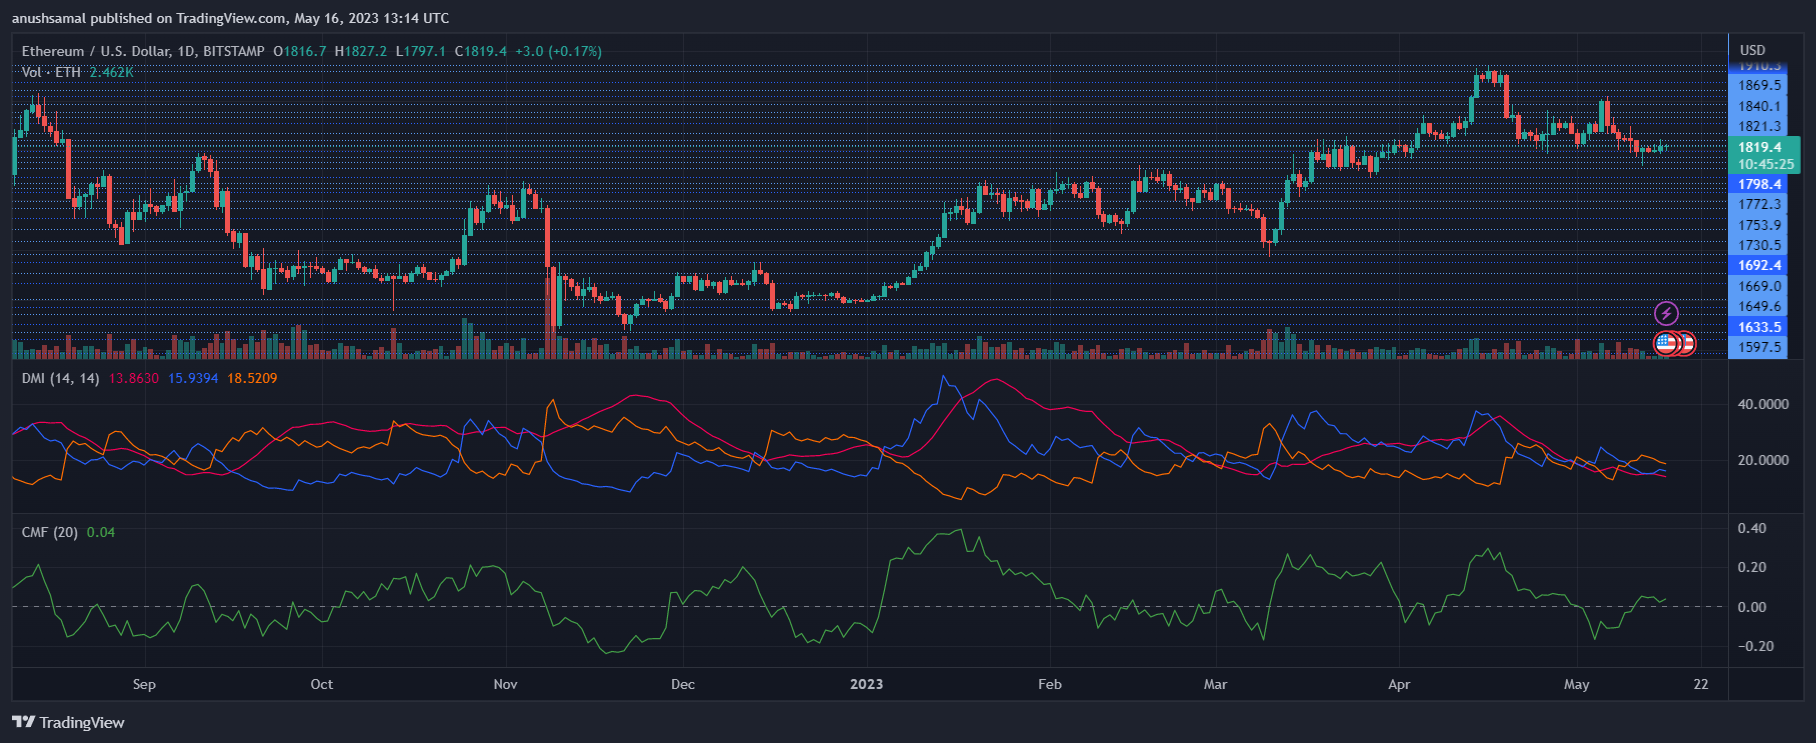
ETH price movement remains negative, in line with other technical indicators. The Directional Movement Index shows a negative trend, with the -DI line (orange) positioned above the +DI line (blue).
The Average Directional Index (red) is below the 20 mark, indicating weak price direction. However, there is a potential hint of recovery suggested by the Chaikin Money Flow indicator. It has moved above the midline, indicating that capital inflows are outpacing capital outflows.
Featured Image from Unsplash, Charts from TradingView.com


