bitcoin (btc) started the week on a negative note. The failure of the bulls to break through and hold above the $38,000 resistance has provided a small window of opportunity for the bears to attempt a comeback. Strong sales have brought the price below $37,000 on November 27.
However, lower levels are likely to attract buyers as the bulls will want to maintain the momentum until the last month of the year. The bears likely have other plans as they will try to deepen the correction. That could increase volatility in the final days of November as both bulls and bears try to achieve a monthly close in their favor.
While near-term uncertainty remains, Rich Dad Poor Dad author Robert Kiyosaki reiterated his long-term bullish view on bitcoin, gold and silver in an X (formerly Twitter) post on November 26. He warned investors to stay away from fiat money. calling it a “FAKE money system.”
Will bitcoin and altcoins bounce off their respective strong support levels, or will the bears prevail? Let’s analyze the graphs to find out.
S&P 500 Index Price Analysis
The S&P 500 Index (SPX) continued its northward march after shooting above the downtrend line. This indicates strong demand at higher levels.
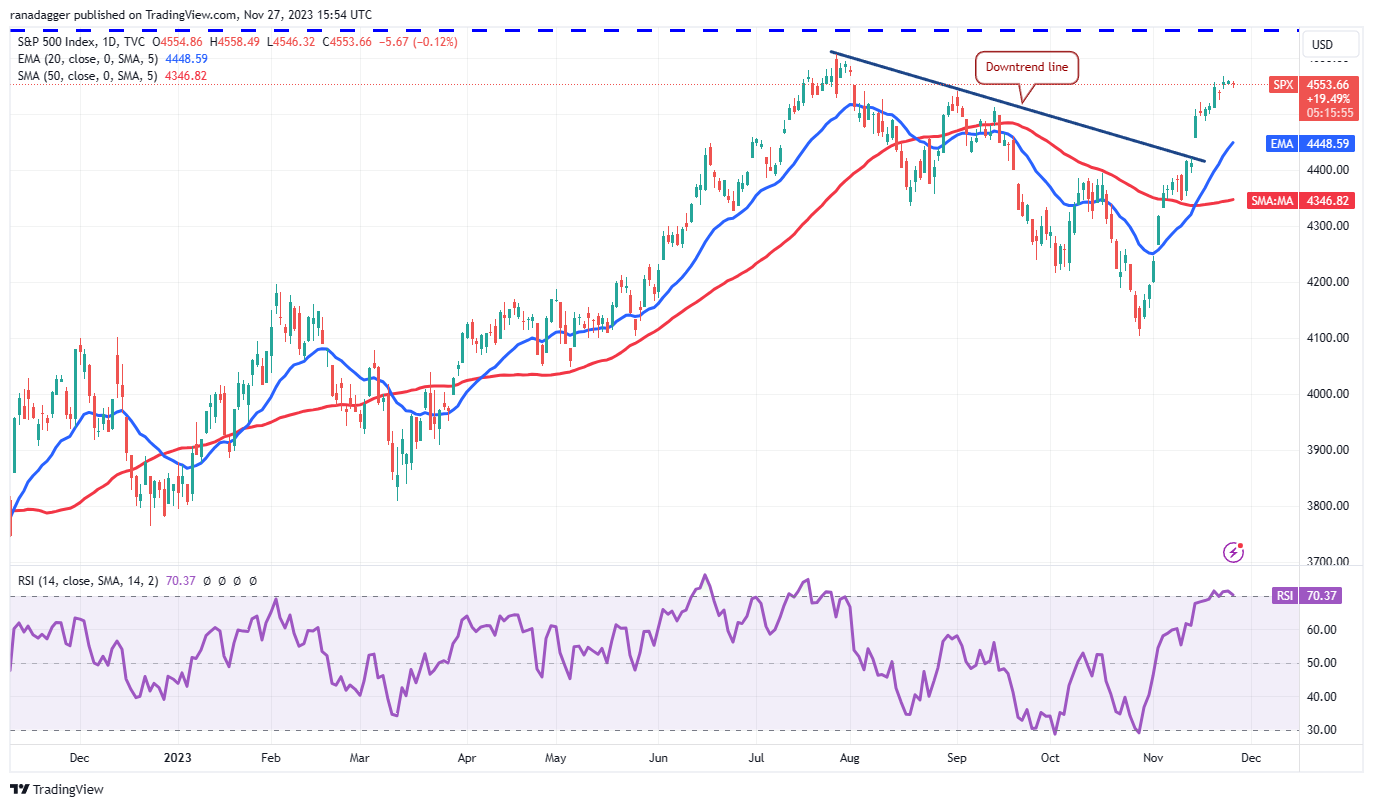
The rally in recent days has pushed the Relative Strength Index (RSI) into the overbought zone, indicating that a small correction or consolidation is possible in the near term. The 20-day exponential moving average (4,448) is the crucial level to pay attention to on the downside.
If the price rises from this level, it will suggest that sentiment remains bullish and traders view dips as a buying opportunity. That improves the prospects of a break above 4,650.
On the contrary, a drop below the 20-day EMA will indicate that the bulls are losing control. The index could then fall to the 50-day simple moving average (4.346).
US Dollar Index Price Analysis
The US Dollar Index (DXY) attempted to recover from the 50% Fibonacci retracement level of 103.46 on November 21, but the bears were in no mood to give in.
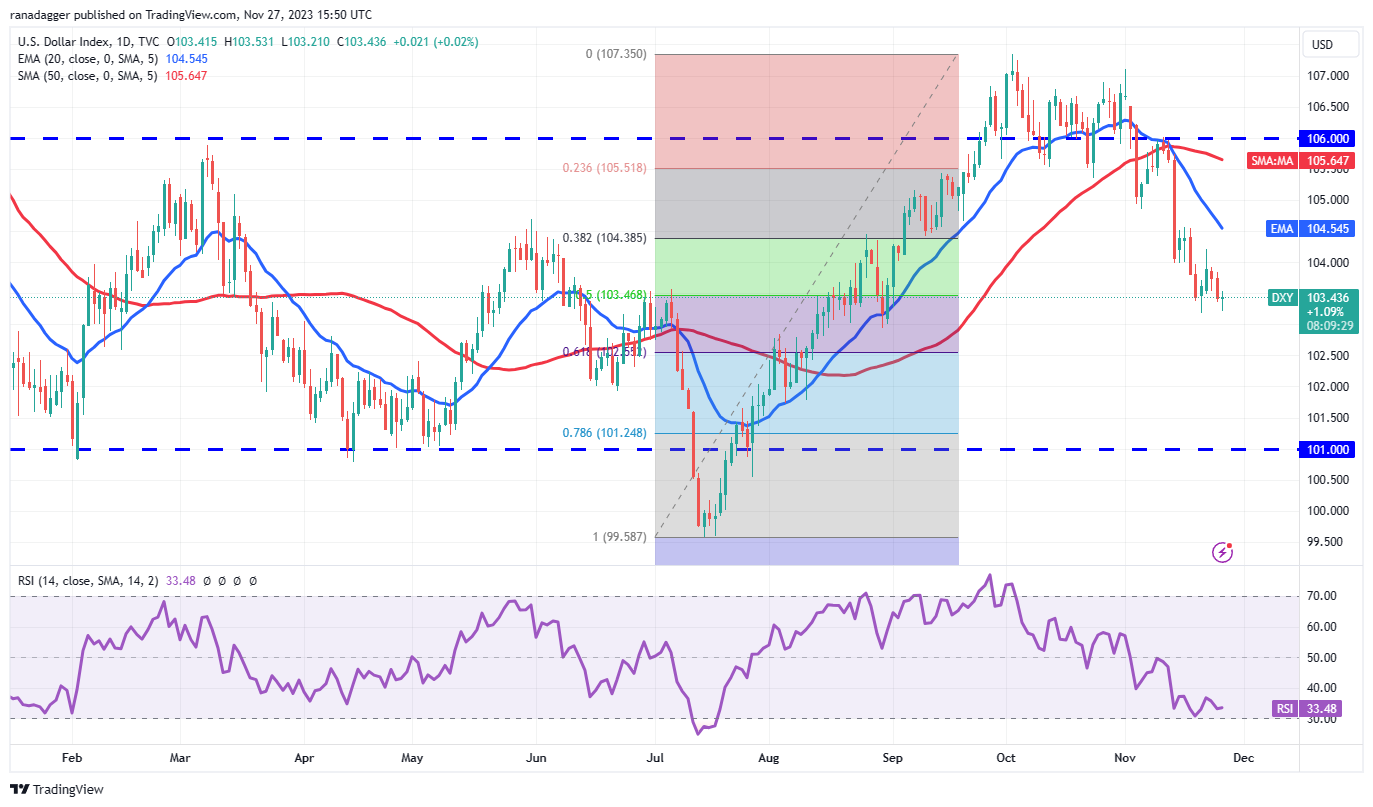
Sellers stopped the relief rally at 104.21 on November 22 and are trying to push the price down towards the 61.8% Fibonacci retracement level of 102.55. The descending 20-day EMA (104.54) and the RSI near the oversold zone indicate that the bears are in control.
The first sign of strength will be a break and close above the 20-day EMA. Such a move will suggest that the correction may be over. The index could then attempt a rally towards the strong resistance at 106.
bitcoin price analysis
The bitcoin price action of the last few days is forming an ascending triangle pattern, which will complete with a breakout and close above $38,000.
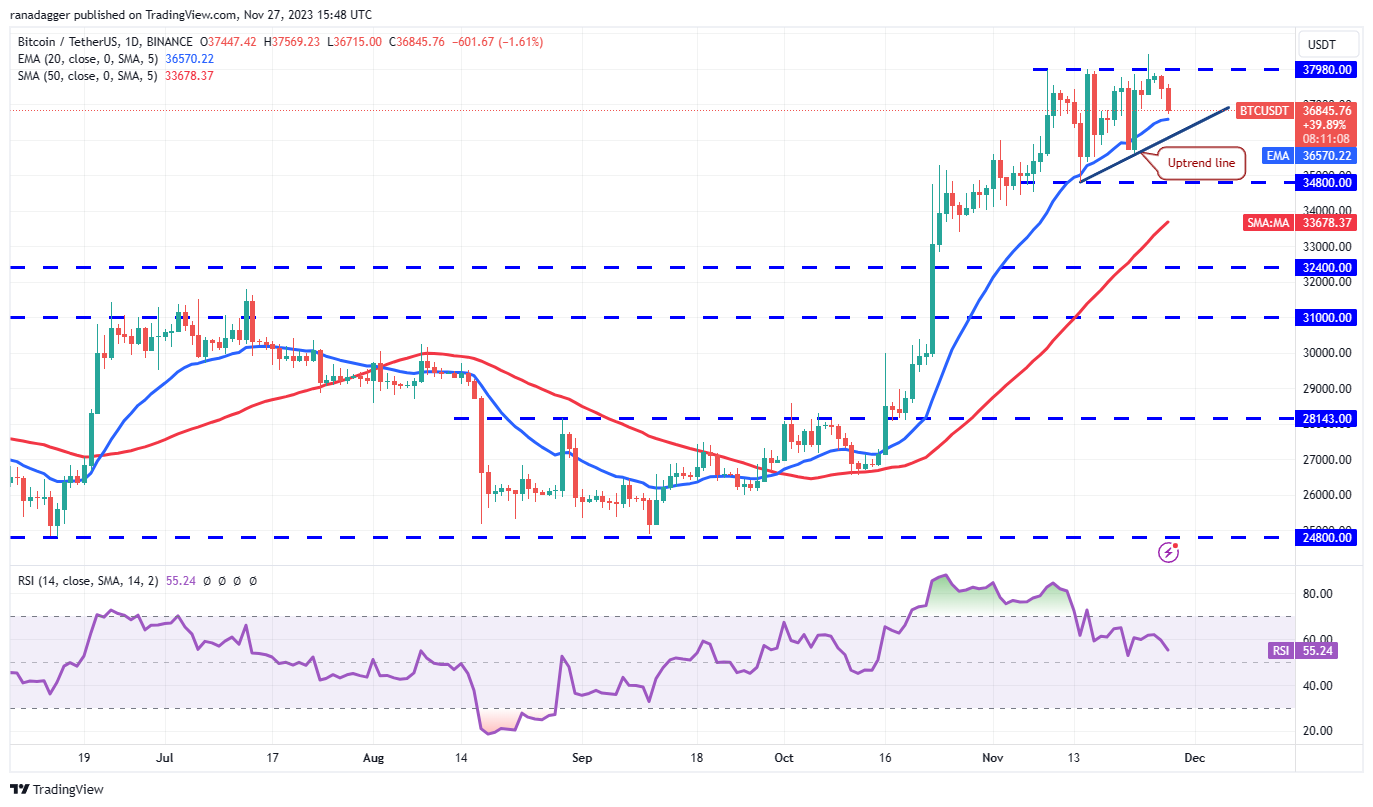
The ascending moving averages and the RSI in positive territory indicate that the path of least resistance is to the upside. If the $38,000 resistance is scaled, the btc/USDT pair may rise to $40,000. This level may act as a hurdle again, but if broken, the pair may rise to the pattern target of $41,160.
The bears will have to drive the price below the uptrend line to invalidate the bullish setup. That may open the doors to a drop to $34,800. If the price bounces off this level, it will suggest action within the range between $34,800 and $38,000. The bears will take advantage on a breakout and close below $34,800.
Ether Price Analysis
Ether (eth) approached the overhead resistance of $2,137 on November 24, but the bulls were unable to overcome this barrier. This may have led to profit booking, as seen in the long wick of the day’s candle.
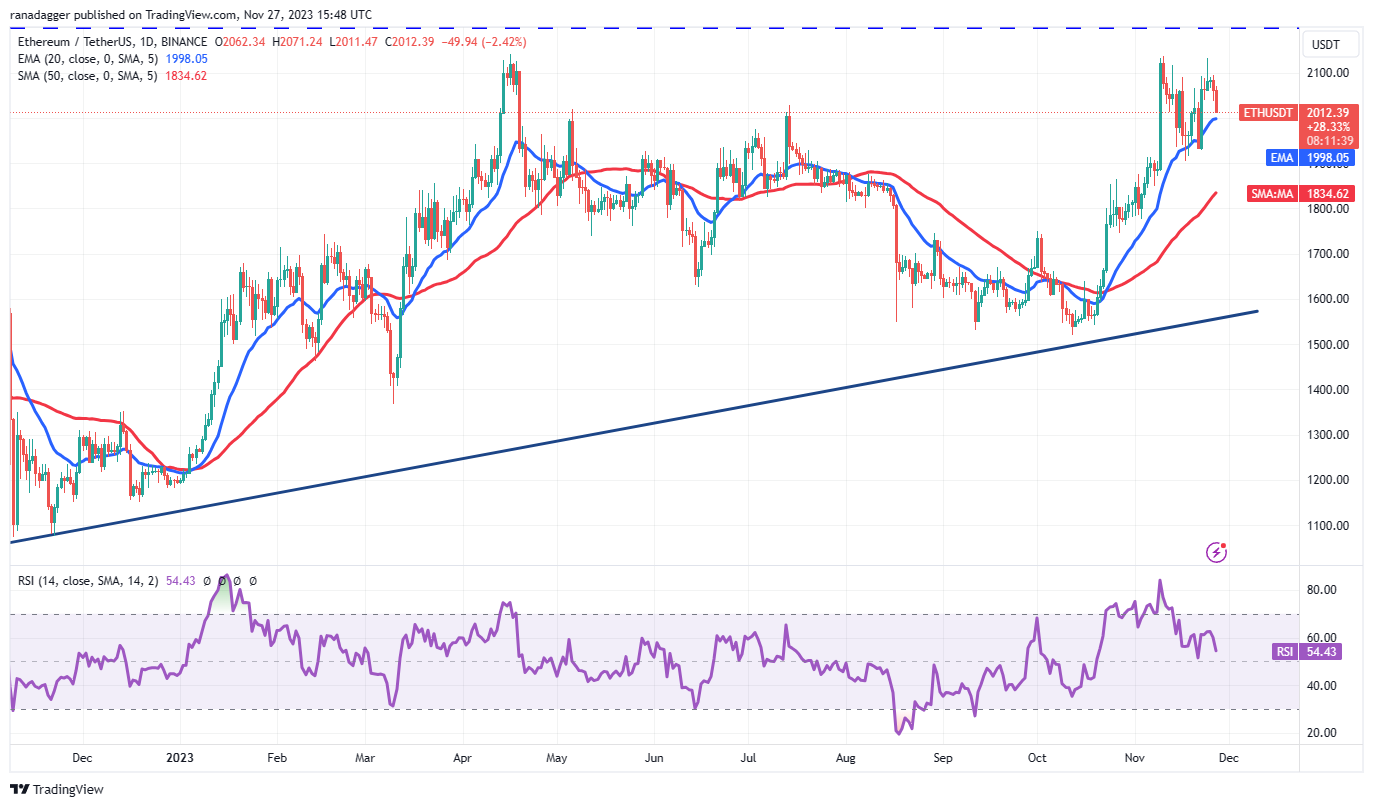
The bears are trying to push the price below the 20-day EMA ($1,998). If they can achieve this, the eth/USDT pair may fall to $1,904. A break below this support will complete a double top pattern. This reversal setup could initiate a deeper correction to the 50-day SMA ($1,834).
Instead, if the price pulls back from the 20-day EMA, it will suggest that lower levels continue to attract buyers. The pair could then rise to the upper resistance zone between $2,137 and $2,200. Buyers will have to ascend through this zone to complete a large ascending triangle pattern.
BNB Price Analysis
The rejection of BNB (BNB) at the 20-day EMA ($237) on November 23 indicates that the bears are trying to turn the level into resistance.
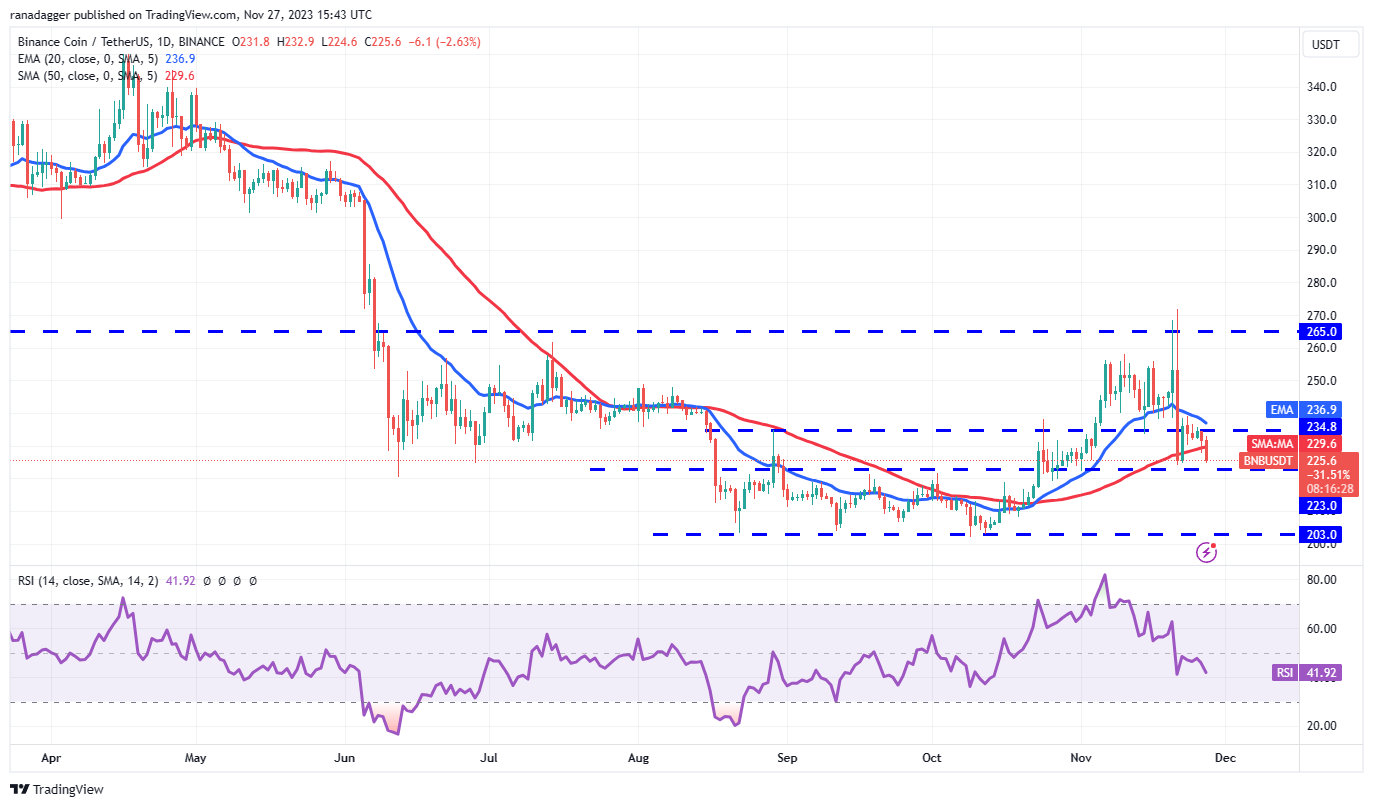
The bears maintained their selling pressure and drove the price below the 50-day SMA ($229). The BNB/USDT pair could slide towards the solid support at $223 and below it to $219. Buyers are likely to defend this area vigorously.
On the upside, the bulls will have to push and sustain the price above $240 to suggest that the selling pressure is reducing. That may start a rally to $255 and later to the main resistance of $265.
XRP Price Analysis
XRP (XRP) bounced off the 50-day SMA ($0.58) on November 22, but hit a wall at the 20-day EMA ($0.61). This suggests that the bears are trying to turn the 20-day EMA into resistance.
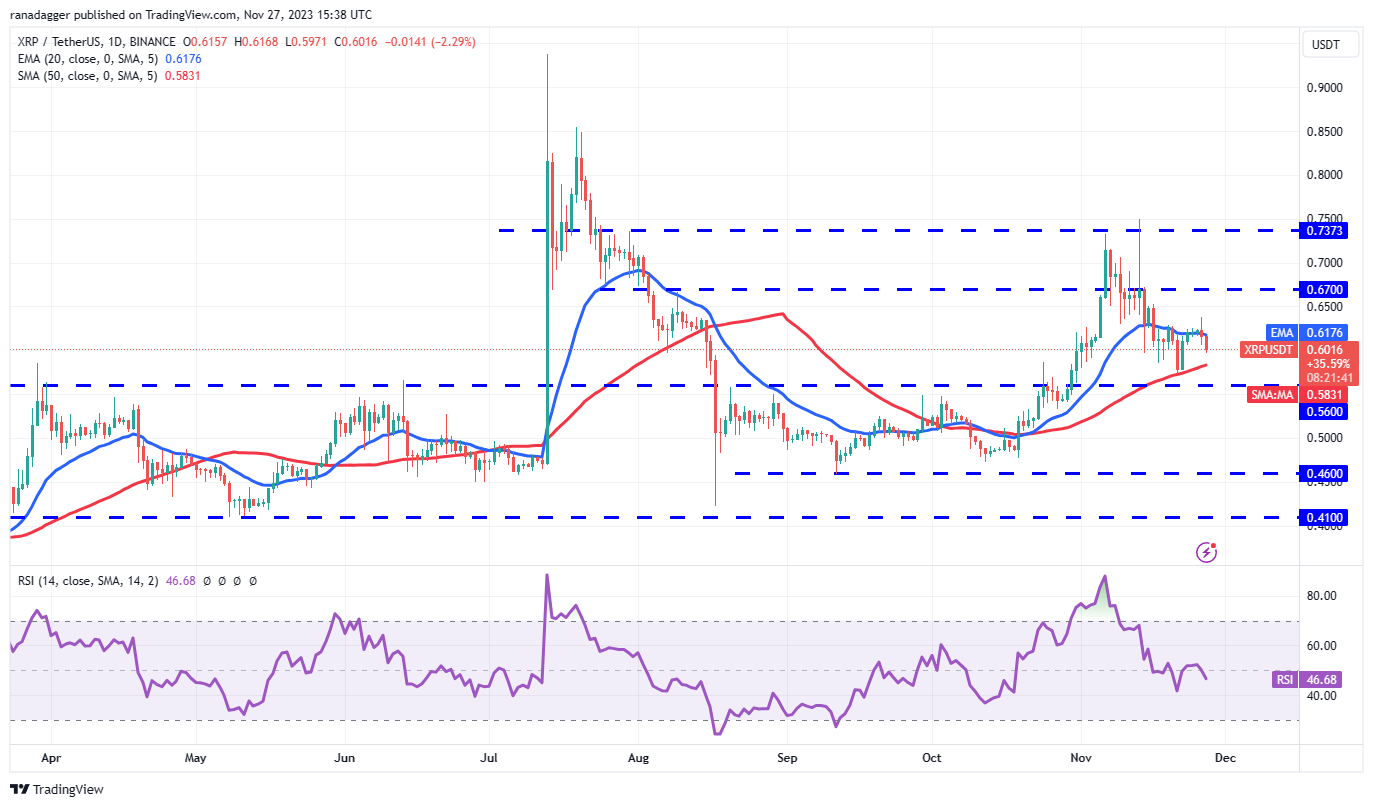
Sellers will try to sink the price below the 50-day SMA and challenge the vital support at $0.56. If this level is broken, it will suggest that the bears are back in control. The XRP/USDT pair could gradually collapse to $0.46.
On the contrary, if the price rises from the current level or $0.56 and rises above the 20-day EMA, it will indicate that the pair may continue to oscillate within the wide range between $0.56 and $0.74.
Solana Price Analysis
Solana (SOL) turned down from the immediate resistance of $59 on November 26, indicating that the bears are trying to stop relief rallies at this level.

The bears will try to further strengthen their position by lowering the price below the 20-day EMA ($53). The SOL/USDT pair will complete a head and shoulders pattern if it breaks below the neckline at $51. That could start a strong correction towards the 50-day SMA ($40) and then towards the pattern target of $34.
The bulls likely have other plans. They will try to stop the decline near $51. If the bounce from this level exceeds $59, it will indicate that the bulls have taken control again. The pair may then retest the local high of $68.
Related: btc Price Targets $40,000 Amid Record Hash Rate: 5 Things to Know About bitcoin This Week
Cardano Price Analysis
Cardano (ADA) failed to break above the overhead resistance of $0.40 in the last three days. This may have tempted short-term traders to book profits.
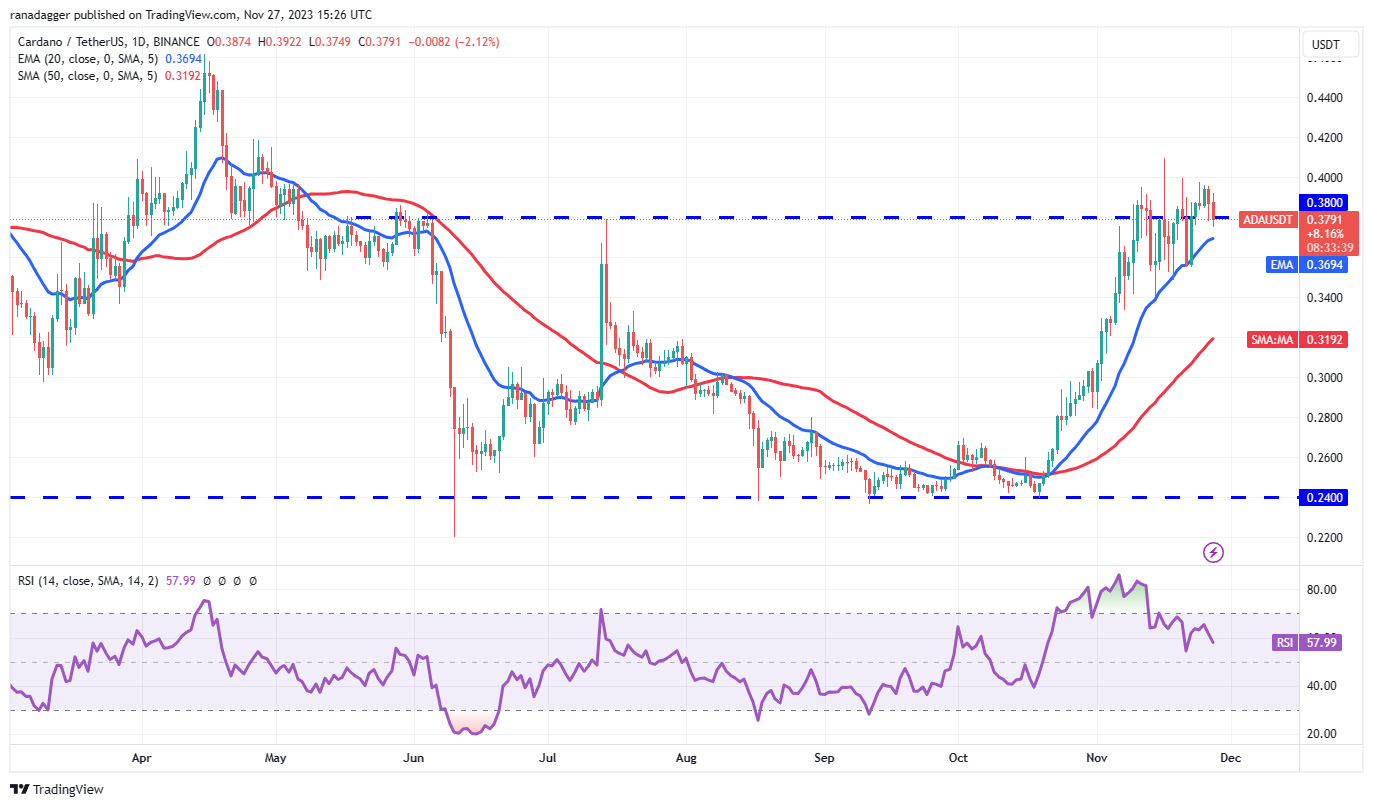
The ADA/USDT pair could fall to the 20-day EMA ($0.37), which will likely attract buyers. If the price bounces strongly off this level, it will indicate that the trend is still positive and traders are buying the dips. The bulls will then make one more attempt to clear the $0.40 hurdle. If they succeed, the pair may shoot up to $0.46.
On the contrary, if the 20-day EMA breaks, the pair may fall to $0.34. Buyers are expected to protect this level because if it breaks, the pair may reach the 50-day SMA ($0.32).
Dogecoin Price Analysis
The bears attempted to pull Dogecoin (DOGE) below the 20-day EMA ($0.08) on November 26, but the bulls bought the dip as seen from the long tail of the candle.
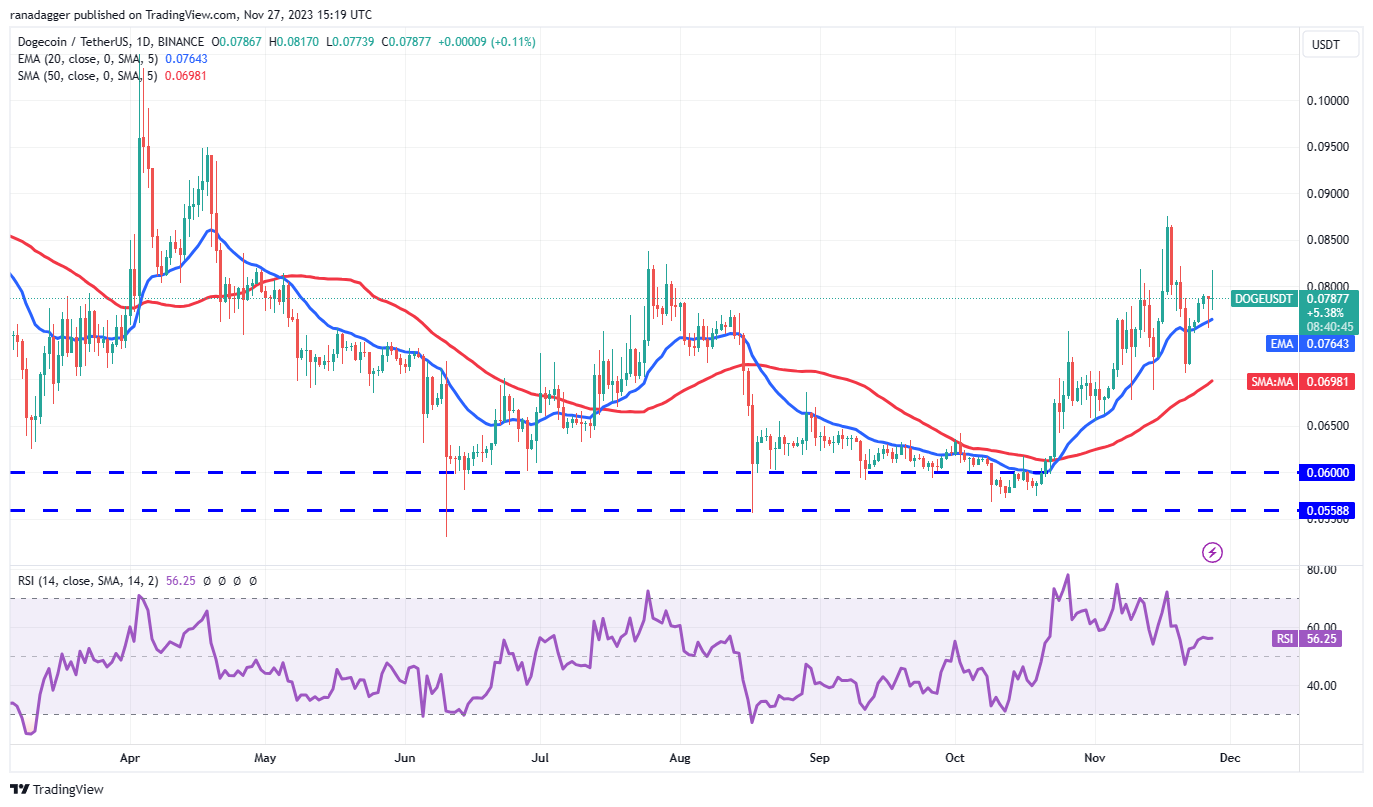
The bulls pushed the price above the $0.08 resistance on November 27, but the long wick of the candle shows solid selling at higher levels. If the price falls below the 20-day EMA, the DOGE/USDT pair could fall to the 50-day SMA ($0.07).
On the contrary, if the price bounces back off the 20-day EMA, it will suggest demand at lower levels. The bulls will again try to push and maintain the price above $0.08. If they do, the pair may gain momentum and rise towards $0.10.
Chain price analysis
Chainlink (LINK) broke above the downtrend line on November 26, but the bulls failed to capitalize on the momentum. This may have attracted selling, bringing the price below the downtrend line on November 27.
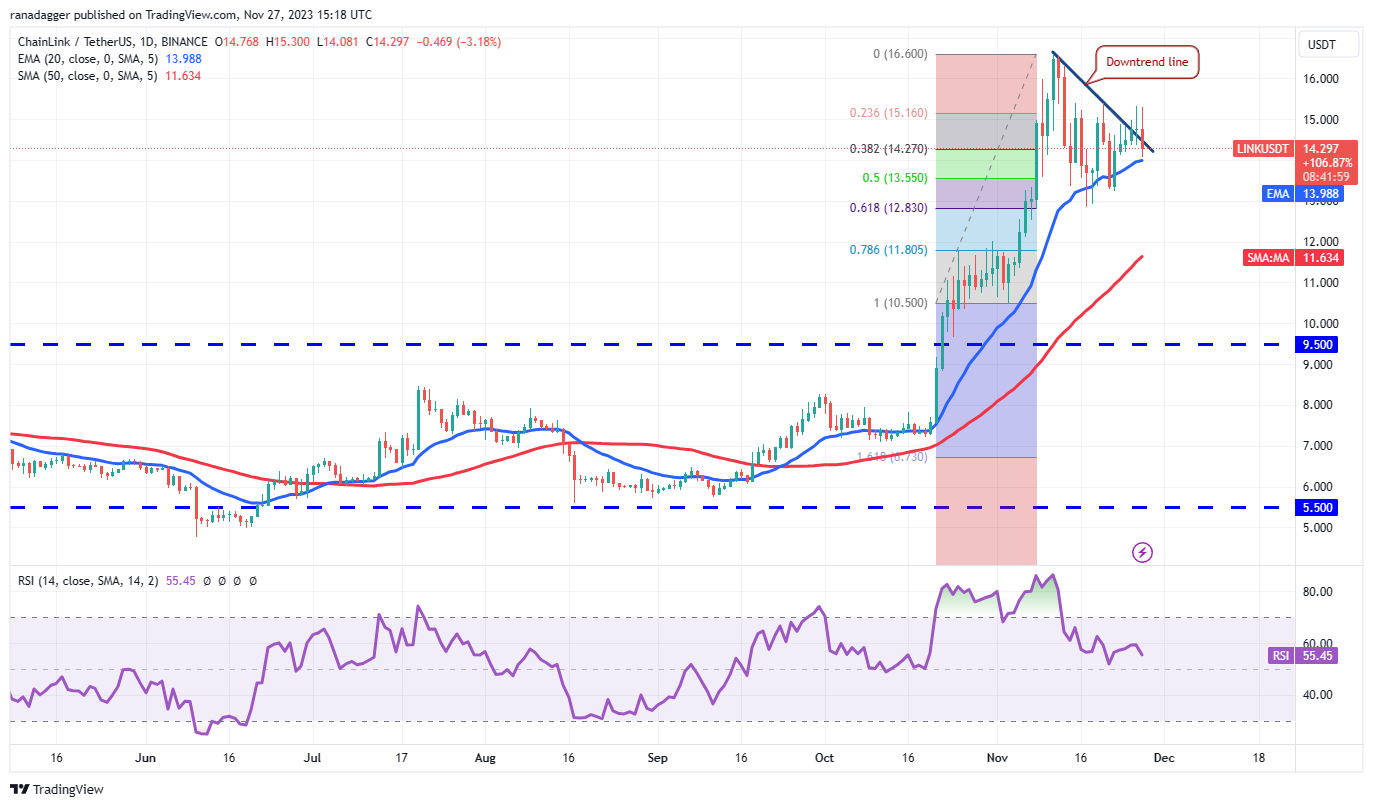
The 20-day EMA ($14) remains the key support to watch in the near term. If the price falls and sustains below the 20-day EMA, it will suggest that the bears are trying to make a comeback. The LINK/USDT pair could then fall to the 61.8% Fibonacci retracement level of $12.83.
On the other hand, if the price bounces off the 20-day EMA, it will suggest that sentiment remains positive and traders are buying on dips. That will improve prospects for a rally to the overhead resistance at $16.60.
This article does not contain investment advice or recommendations. Every investment and trading move involves risks, and readers should conduct their own research when making a decision.


