
Bitcoin and US stock markets are attempting to rally, but selling off of resistance above could continue to weigh on bullish momentum.
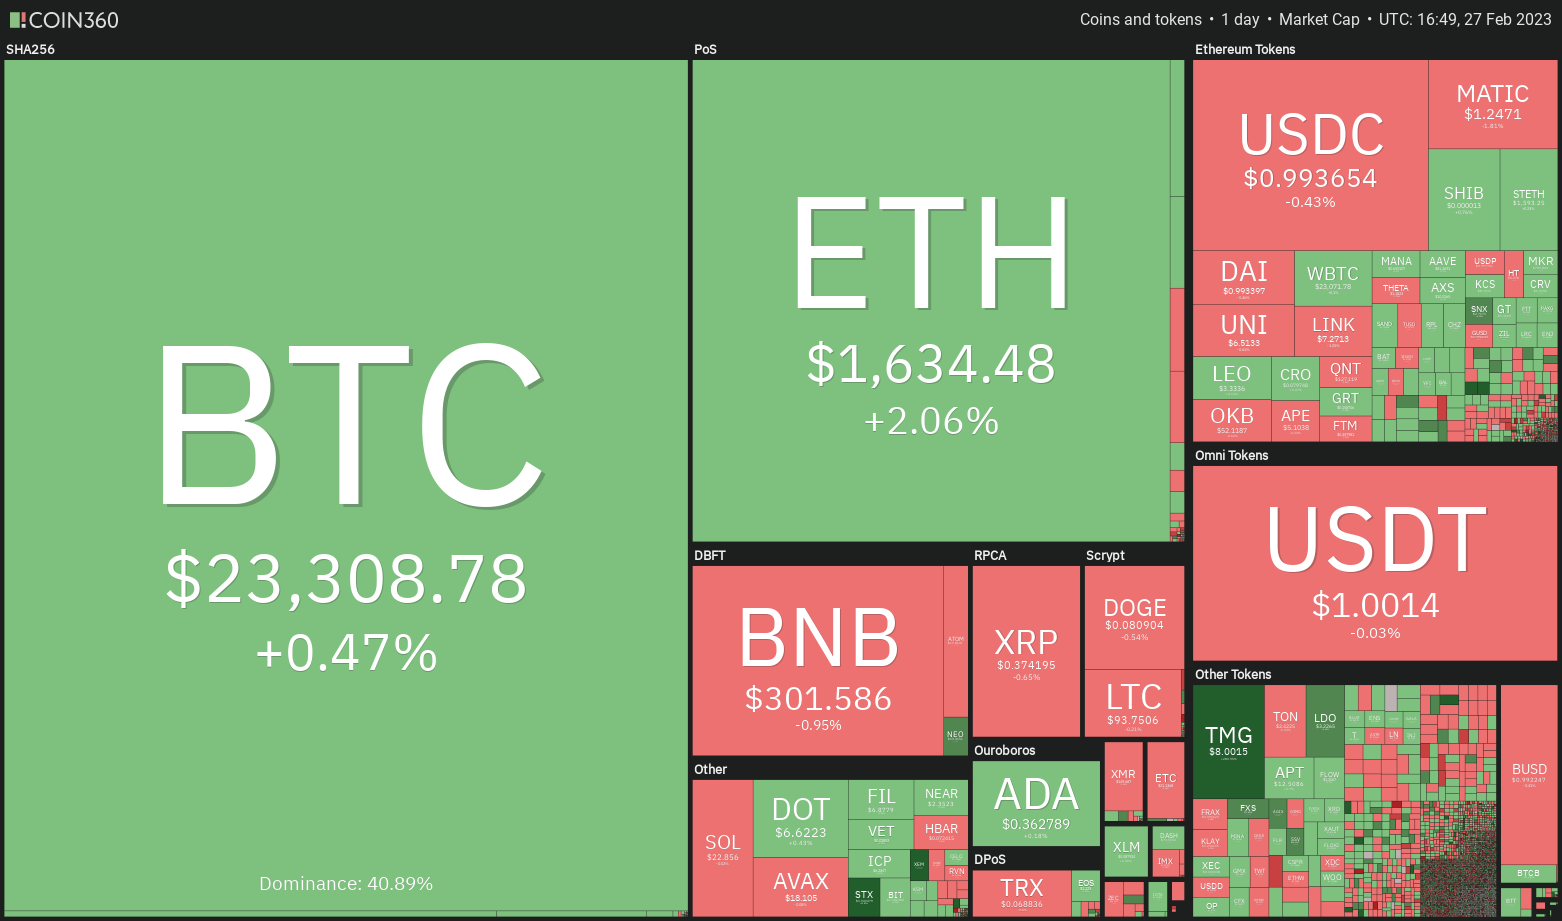
Bitcoin (BTC) and the United States stock markets are trying to start the week on a positive note, but some analysts are skeptical about the near-term outlook for the markets. According to Bloomberg Intelligence senior macro strategist Mike McGlone, Bitcoin will face significant resistance at $25,000. McGlone believes that “it may be a while before the buy-and-hold types gain the upper hand.”
It also appears that the Bitcoin whales, single entities holding 1,000 Bitcoin or more, are also not convinced by the recovery of the crypto markets. According to Glassnode, the number of Bitcoin whales has fallen to 1,663, well below the peak of 2,161 reached in February 2021.
It is difficult to reach the bottom in any market. Therefore, traders should try to build a portfolio when they believe the downtrend has ended and a base pattern has begun.
Instead of buying the full amount at once, they could gradually build a portfolio and try to finish the purchases before the asset picks up momentum and shoots higher.
Could strength in equity markets push Bitcoin and altcoins higher? Let’s study the graphs to find out.
SPX
The S&P 500 Index (SPX) fell below the 20-day exponential moving average (4046) on February 17, intensifying the selling and pushing the price towards the uptrend line. Although the bears pushed the price below the uptrend line on Feb. 24, the lower levels attracted buying, as seen by the long tail of the day’s candle. That helped the index close near the uptrend line.
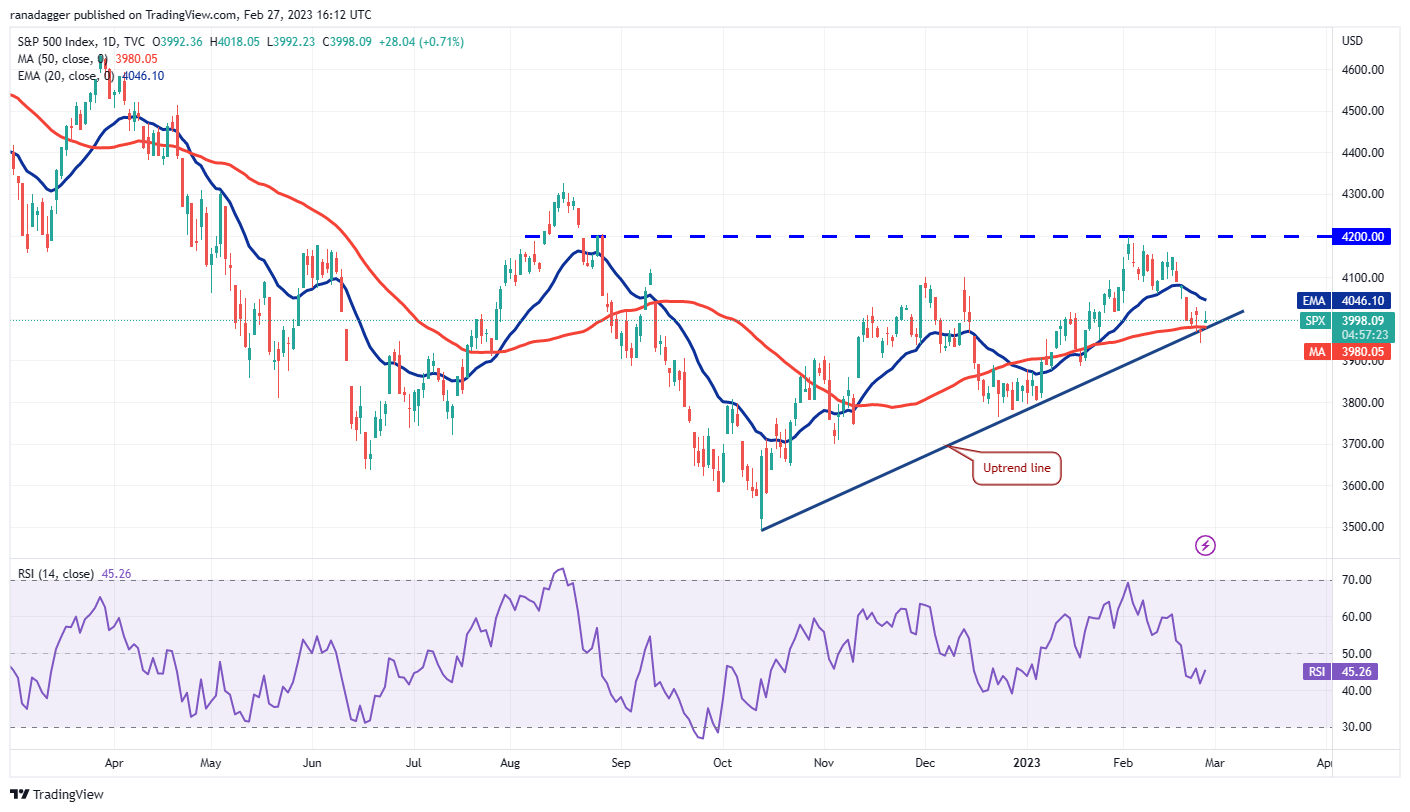
The bulls may face an uphill task as the bears are likely to sell on any relief rally near the 20-day EMA, as seen from the long wick on the February 27 candle. If the price turns down from the 20 day EMA, it will suggest that sentiment is negative and that traders are selling minor rallies. A close below the uptrend line may open the door for a possible drop to 3,764.
If the bulls want to salvage the situation, they will have to push the price above the 20 day EMA. If they do, it will indicate that the break below the uptrend line may have been a bear trap. The index could then attempt a rally to the 4,200 overhead resistance.
DXY
The bulls successfully defended the retest of the wedge pattern breakout level on Feb 20, kicking off a stronger relief rally in the US Dollar Index (DXY).
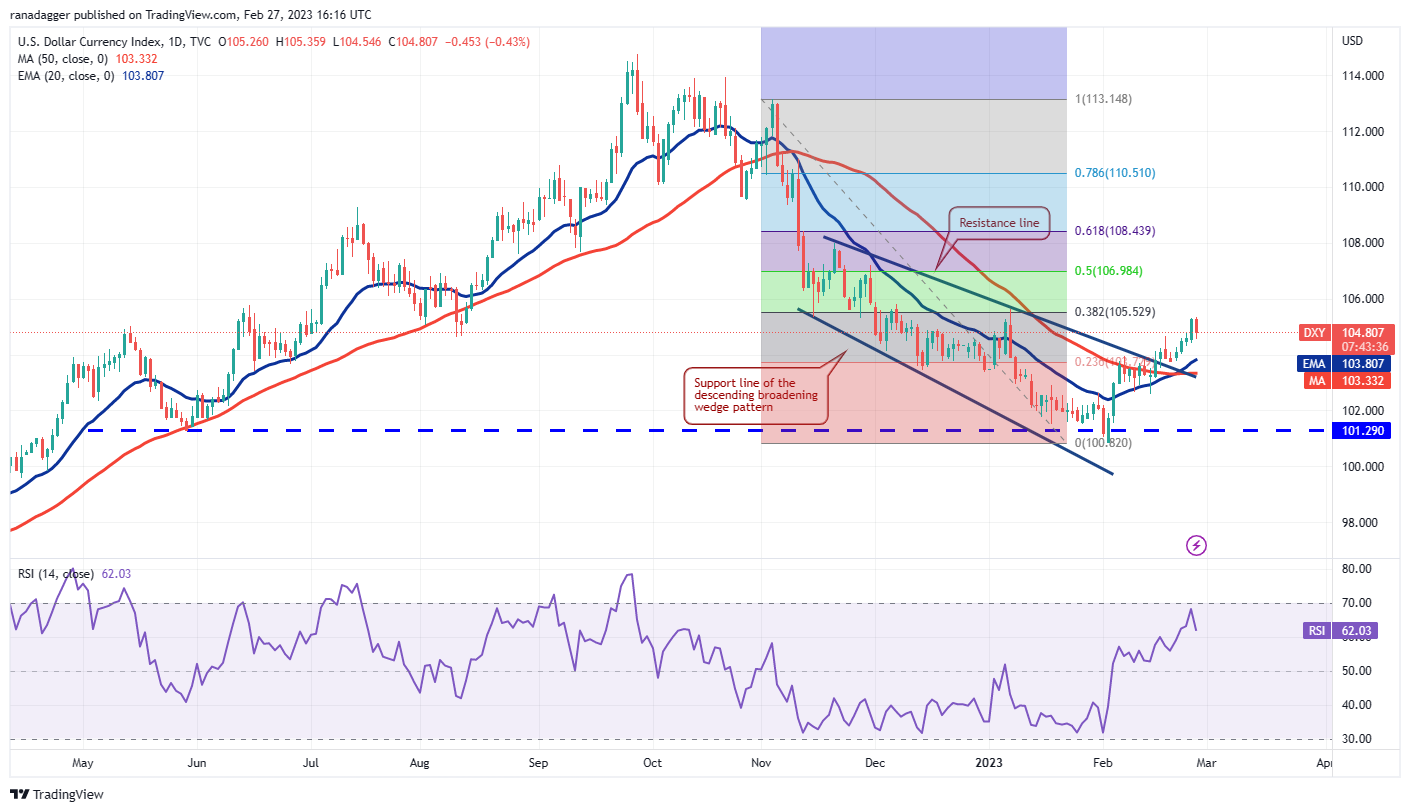
The index has reached the 38.2% Fibonacci retracement level of 105.52. This level may see an attempt by the bears to stop the rally. If the sellers want to maintain their control, they will have to sink the price below the moving averages.
On the other hand, if the bulls want to strengthen their position, they will need to push the price above 105.52. If they can do that, the index could extend its rally to the 50% retracement level of 106.98 and then to the 61.8% retracement level of 108.43.
USDT/BTC
Bitcoin rallied from the $22,800 support on February 25 and broke above the 20-day EMA ($23,417) on February 26. This suggests that the lower levels are attracting buyers.
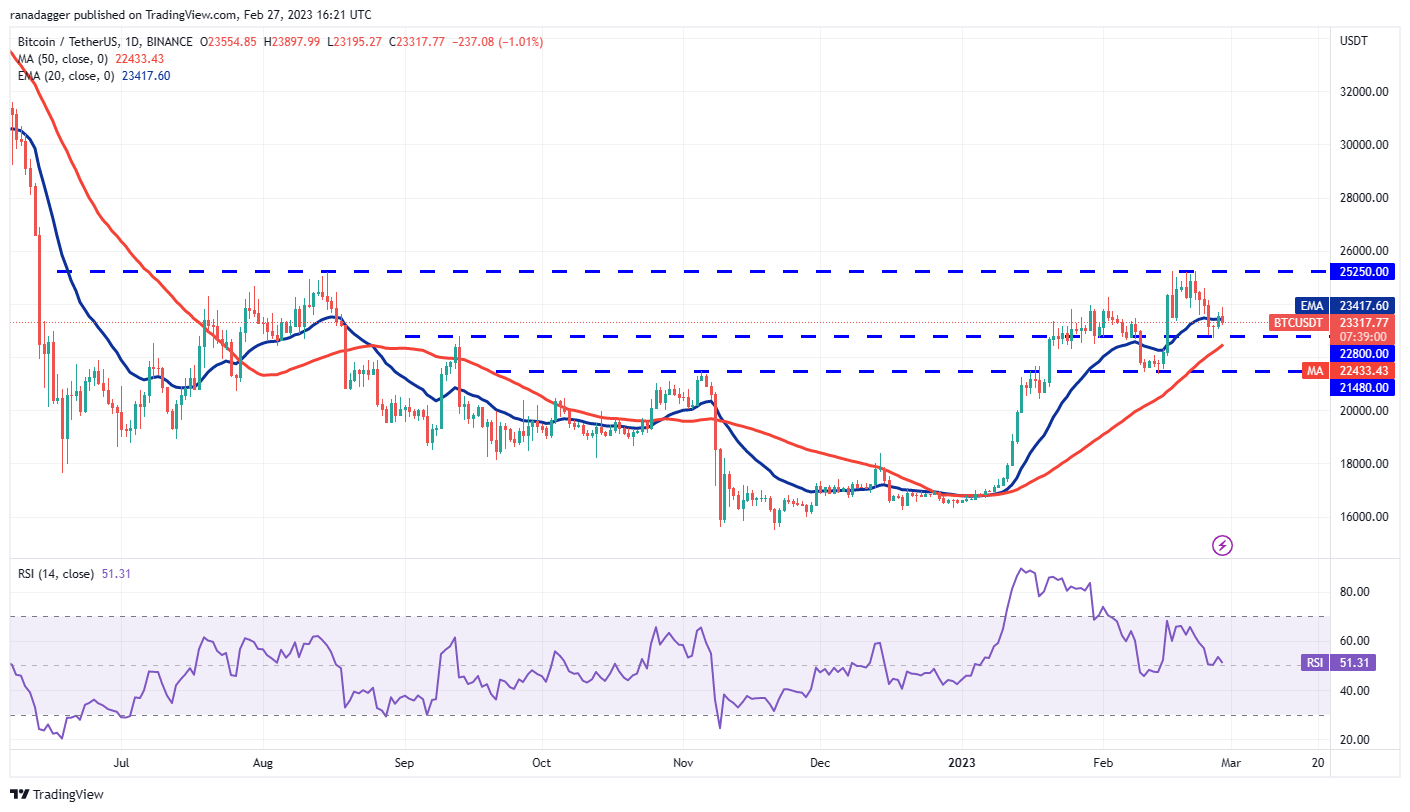
However, bears may not give up easily. They will try to pull the price back below the 20-day EMA and challenge the 50-day simple moving average ($22,433). If this level gives way, the BTC/USDT pair can plummet to the next major support at $21,480.
Alternatively, if the price bounces back to $22,800, it will indicate that the buyers are fiercely defending this level. That may indicate a range-limited stock between $22,800 and $25,250 for a few days.
EUR/USDT
Ether (ETH) rallied from the 50-day SMA ($1,587) on Feb. 25, indicating that the bulls are fiercely defending this level. The 20-day EMA ($1626) has leveled off and the RSI is just above the midpoint, indicating a balance between supply and demand.
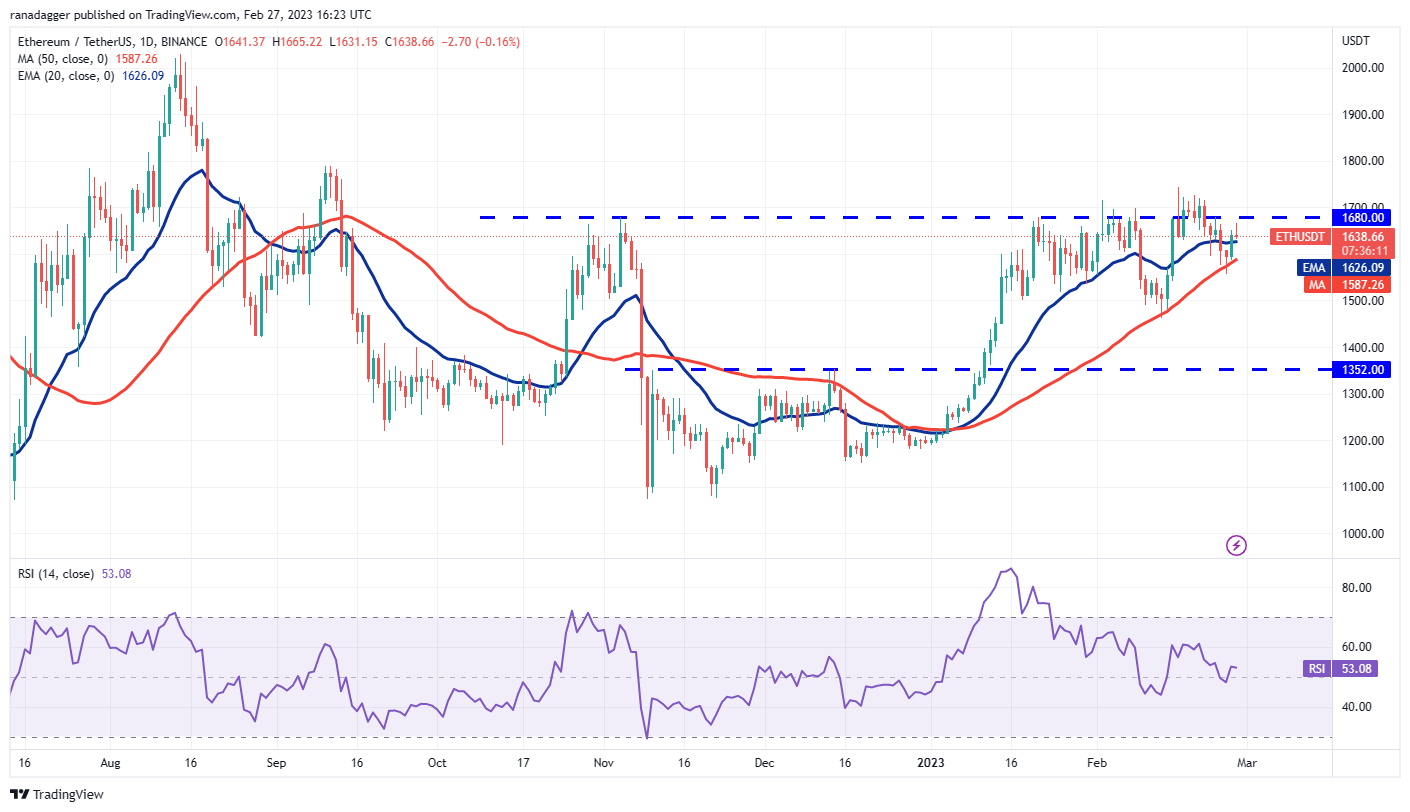
This balance will tilt in favor of the bulls if they push and close the price above $1,680. The ETH/USDT pair will attempt to break out of the $1800 resistance and start its journey towards the psychological $2000 level.
Alternatively, if the price turns down once more from the overhead resistance, it will indicate that the bears are not willing to give up. That may increase the possibility of a break below the 50-day SMA. Then the pair could fall to $1,460 and then to $1,352.
USD/USDT
BNB (BNB) broke out and closed below the 50-day SMA ($307) on Feb. 24, but the bulls bought the dip and pushed the price to the 20-day EMA ($309) on Feb. 26. This level is attracting selling by the bears.
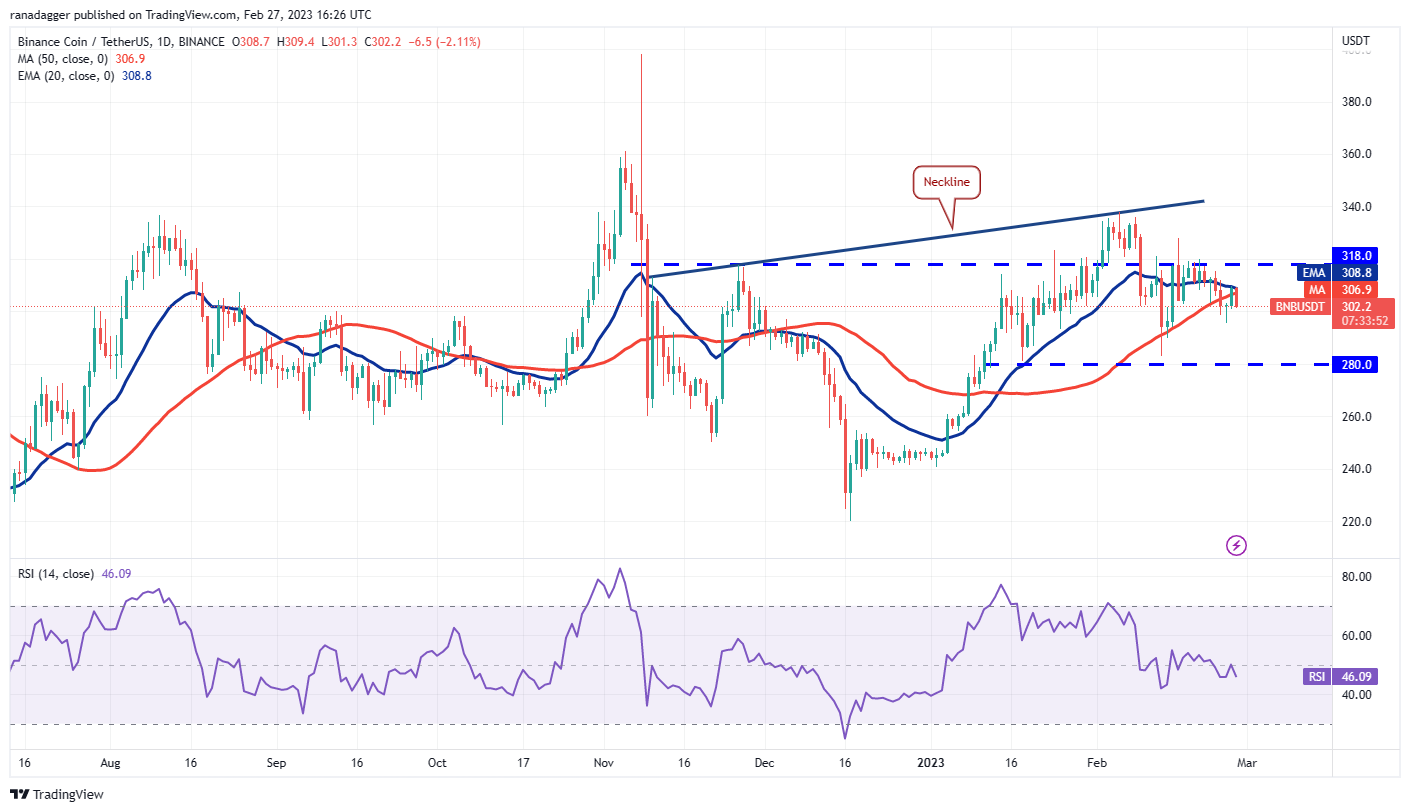
If the price turns down and falls below $295, it will indicate that the sellers have turned the 20-day EMA into resistance. The BNB/USDT pair could fall towards the critical support at $280. This is an important level to watch because a bounce can point to a range formation between $280 and $318 for some time.
The next short-term trend move could start if the buyers push the price above $318 or the bears push the price below $280.
USD/XRP
The price of XRP (XRP) has been oscillating within a wide range between $0.30 and $0.43 for the past few weeks. The price broke below the 50-day SMA ($0.39) on February 23 and has been gradually falling towards the solid support of $0.36.
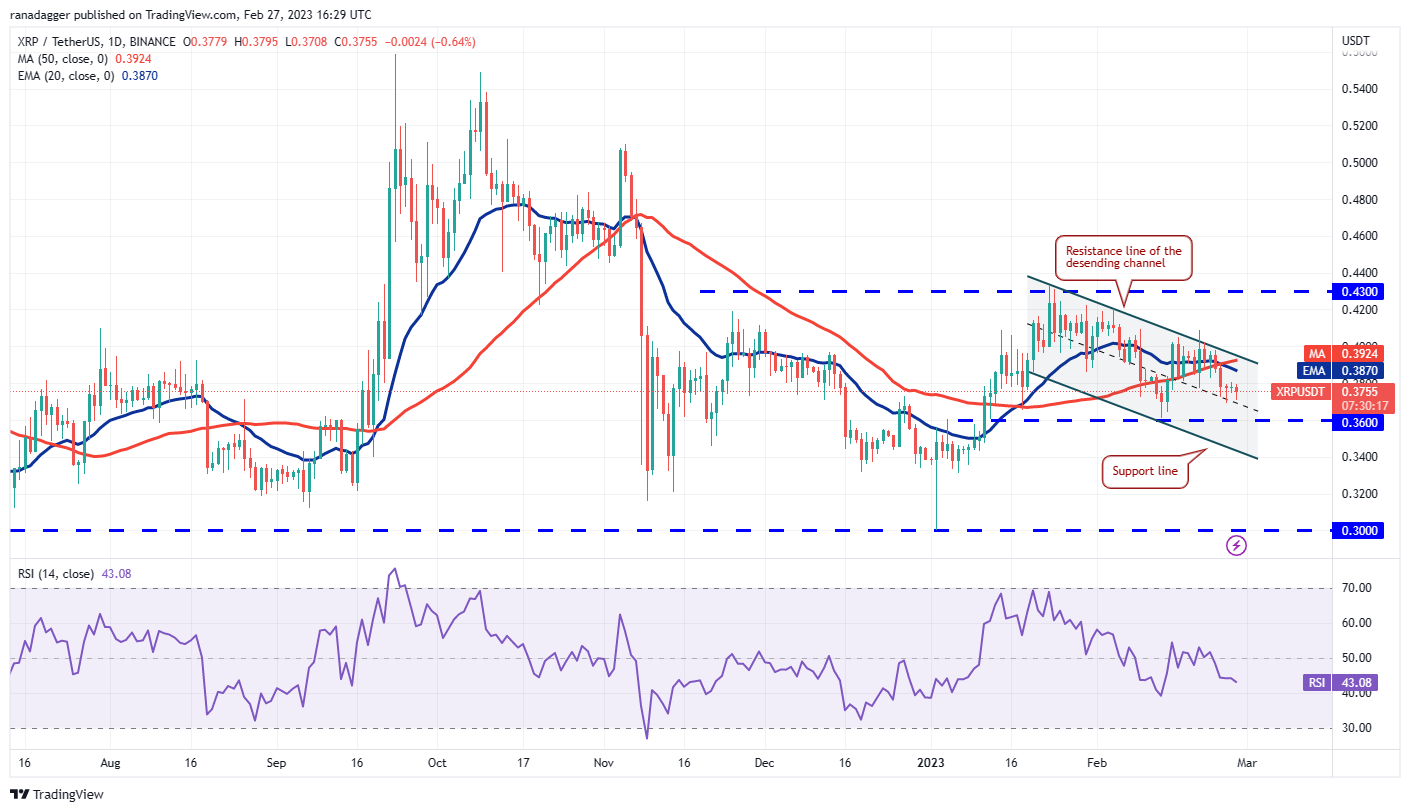
The 20-day EMA ($0.38) has started to turn down and the RSI is in the negative territory, indicating that the bears have a slight advantage in the short term. If the price falls below $0.36, the XRP/USDT pair can slide towards the support line of the descending channel.
This negative view could be invalidated in the short term if the price rises and rises above the channel. The pair could then attempt a rally towards the overhead resistance at $0.42, where the bears are expected to mount a strong defense.
ADA/USDT
Cardano (ADA) bounced off $0.35 on Feb. 25, but the rally is facing selling at the 50-day SMA ($0.37). This indicates that the bears are trying to turn the level into resistance.
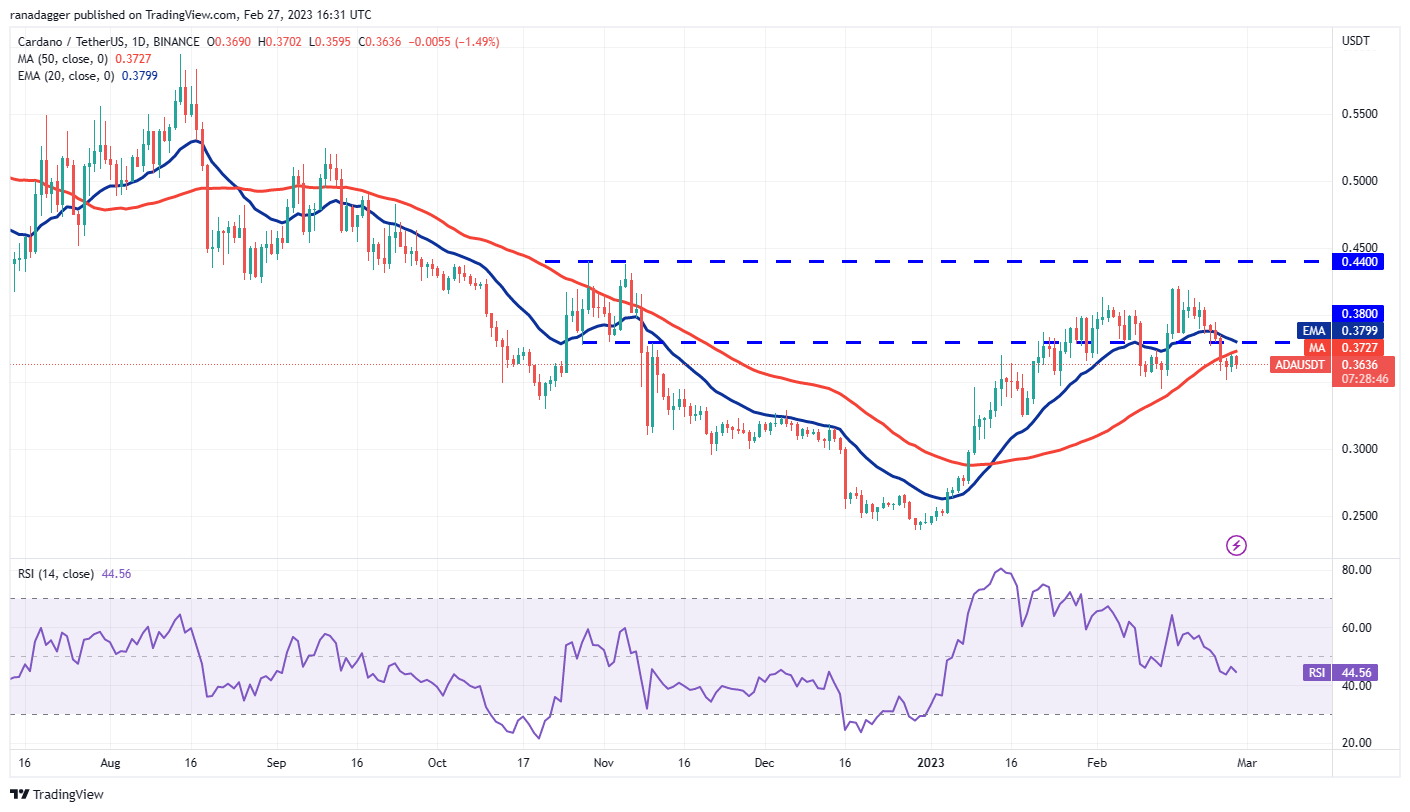
The moving averages are on the verge of a bearish crossover, with the 20-day EMA ($0.38) dipping below the 50-day SMA. Such a move will suggest that the bears have the upper hand in the short term. A break and close below the strong support zone between $0.34 and $0.32 could start a slide to $0.26.
If the bulls want to avoid the downtrend, they will have to push the price above the 20 day EMA. The ADA/USDT pair can rise to the resistance zone of $0.42 to $0.44.
Related: Bitcoin Price Eyes Retest of $24K as US Dollar Dips to Monthly Close
MATIC/USDT
Polygon (MATIC) dipped below the 20-day EMA ($1.30) on February 24 and the bears successfully retested it on February 26. This indicates that the 20 day EMA is acting as the new top.
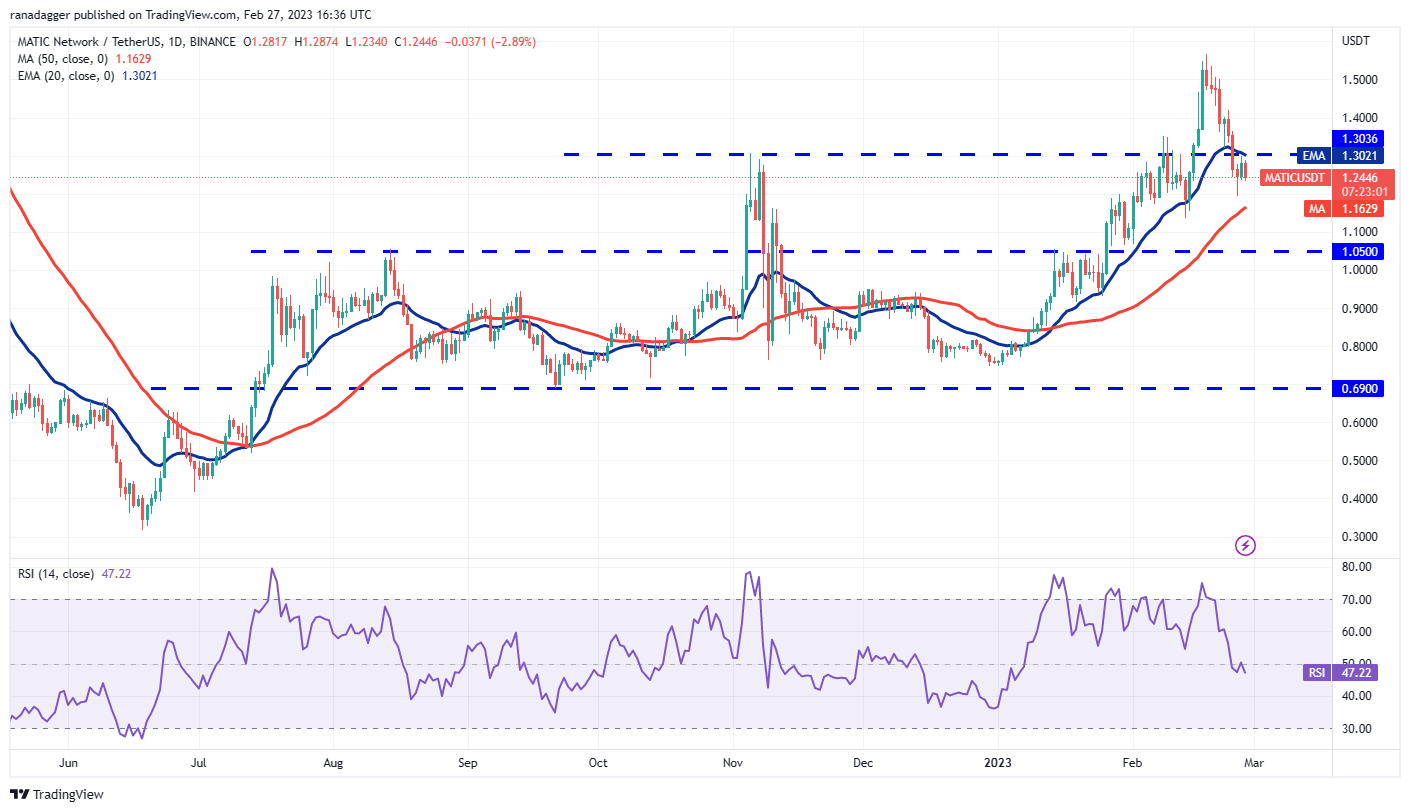
Next, the bears will try to sink the price below the 50-day SMA ($1.16). If they succeed in this effort, the selling could intensify and the MATIC/USDT pair could drop to the next strong support at $1.05.
If the buyers want to regain the advantage, they will have to push the price above the 20 day EMA. That will indicate solid buying on dips. The pair can first rally to $1.42 and then rally to the $1.50 to $1.57 resistance zone.
DOGO/USDT
Dogecoin (DOGE) bounced off the strong support near $0.08 on Feb. 25, but the rally is facing selling pressure from the bears on Feb. 27.
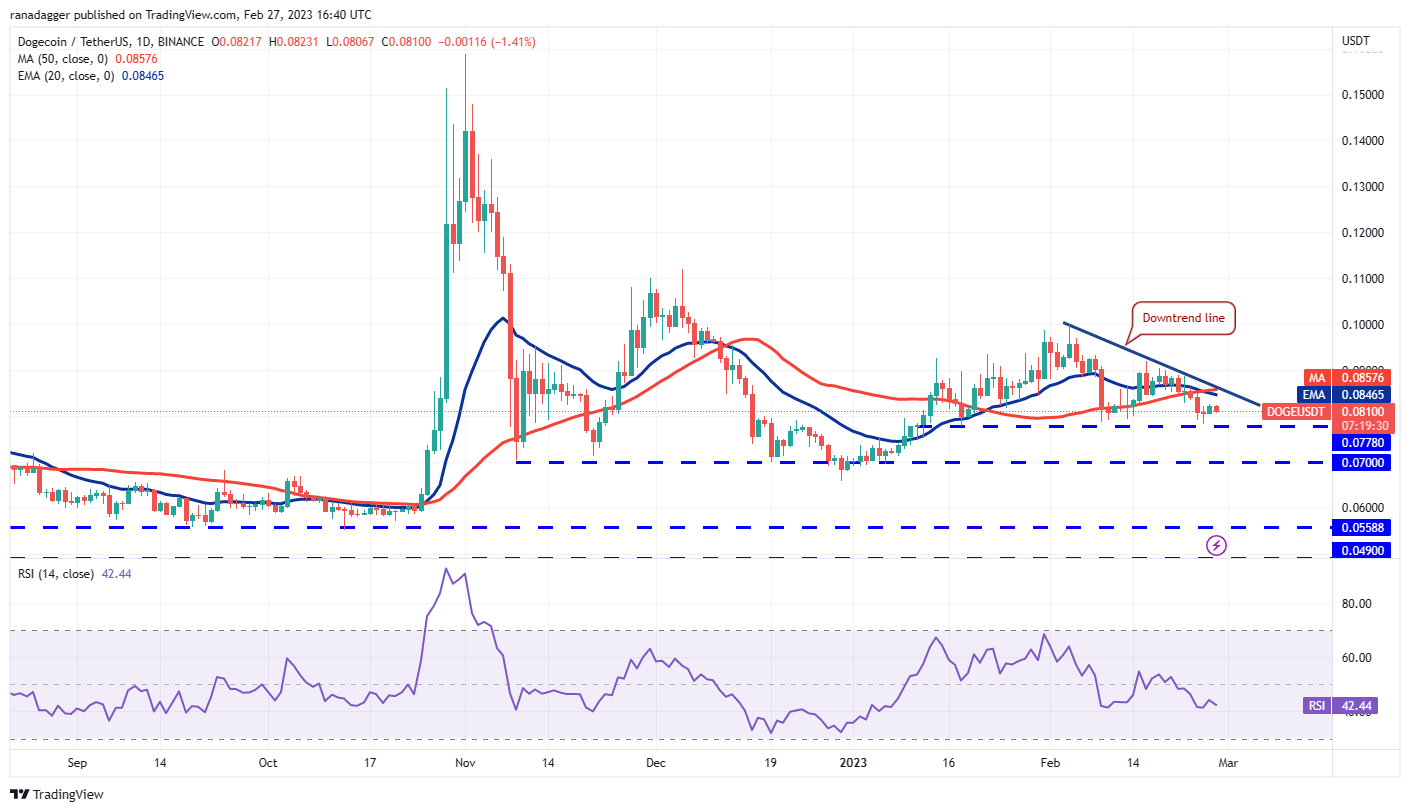
The moving averages have completed a bearish crossover and the RSI is in the negative territory, indicating that the bears have the upper hand. A break and close below the $0.08 support will complete a head and shoulders pattern in the short term. The DOGE/USDT pair could plummet to $0.07.
Contrary to this assumption, if the price rises from the current level or $0.08, it will indicate that the lower levels are seen as a buying opportunity. The relief rally may face selling near the downtrend line, but if the bulls break out of this barrier, the pair could attempt a rally to $0.10.
SOL/USDT
Solana (SOL) is witnessing a tough battle between the bulls and the bears near the 50-day SMA ($22.75). This indicates that the bulls are trying to protect the level while the bears are trying to break it and reach the top.
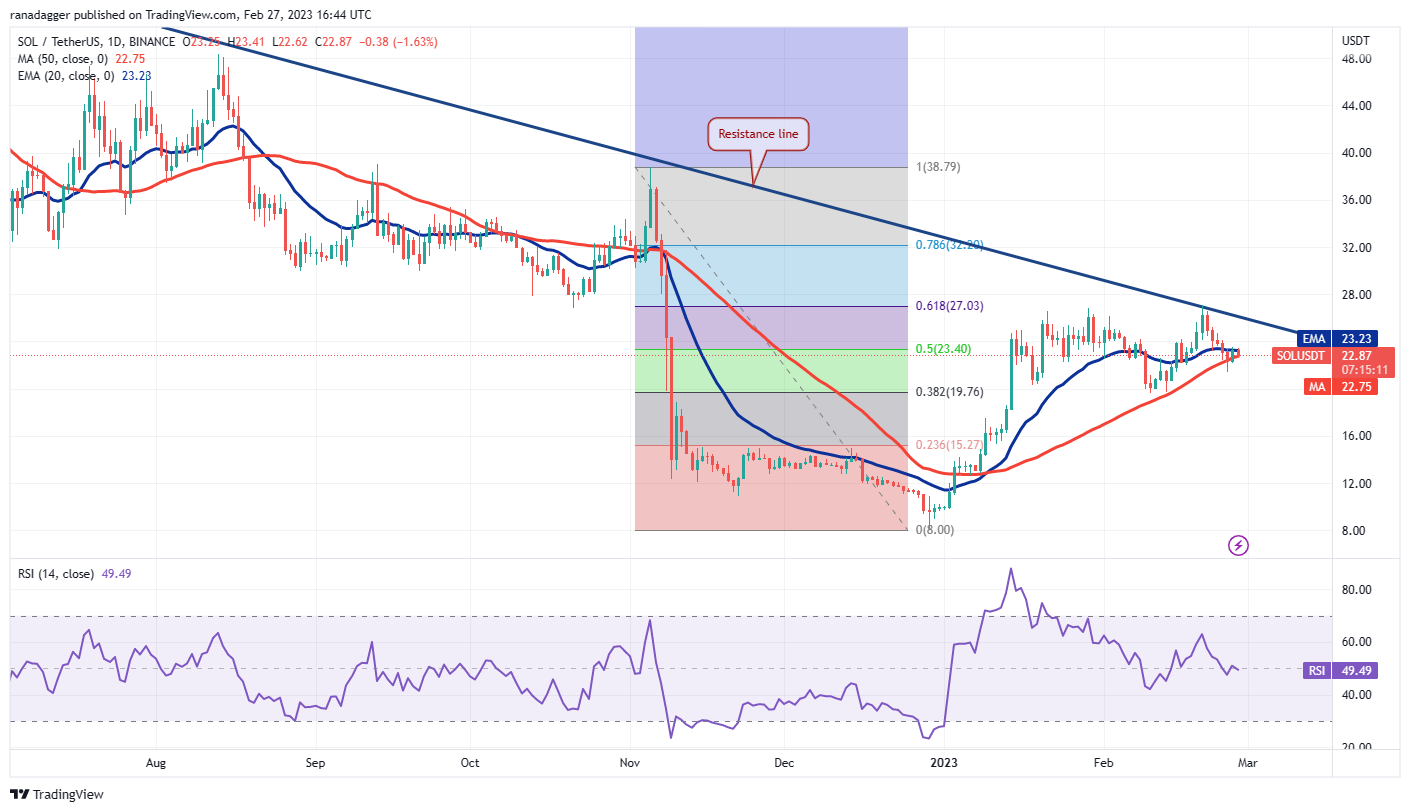
If the price falls below $21.41, the SOL/USDT pair could drop to the important support at $19.68. This is an important level for bulls to defend because a close below can add to the selling pressure and sink the pair to $15.
Conversely, if the price turns higher and rises above the 20-day EMA ($23.23), the bulls will push the pair to the resistance line. The bears are likely to defend this level with all their might, but if the buyers break through this hurdle, a move to $39 is possible.
The views, thoughts and opinions expressed here are those of the authors alone and do not necessarily reflect or represent the views and opinions of Cointelegraph.
This article does not contain investment advice or recommendations. Every investment and trading move involves risk, and readers should do their own research when making a decision.


