The rally in stocks could be giving Bitcoin a boost, and the crypto market could see more fireworks if the Federal Reserve confirms investor expectations that rate hikes will slow.
The Bitcoin (BTC) price is up 37% year to date and shows no signs of slowing down. The S&P 500 Index (SPX) has also had a winning start to the year, but has seen a relatively moderate rally of about 4%.
While the price of risk assets is rising, the US dollar index (DXY), perceived as a safe haven, extended its downtrend, falling more than 1% in January.
The shift in sentiment towards risky assets may have been triggered by expectations that the US Federal Reserve could slow its rate hikes as inflation cools. Some analysts even expect the Fed to turn around and start cutting rates before the end of the year.
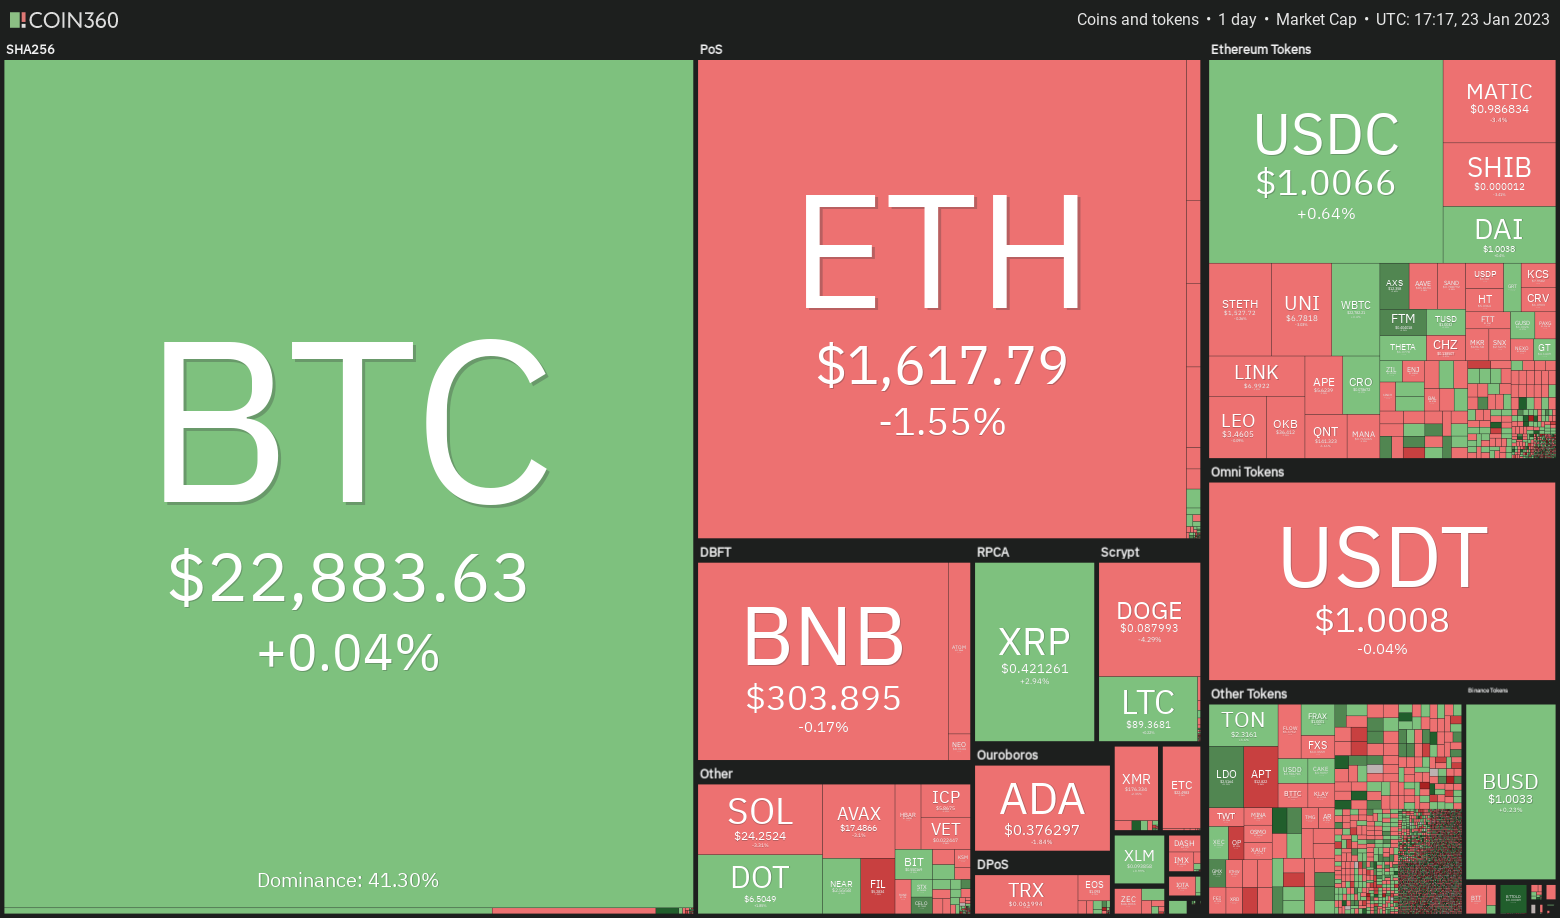
Several analysts remain skeptical of Bitcoin’s rally, but the longer the price stays above $20,000, the greater the chance that the macroeconomic low has been hit in November. If the next dip forms a higher low, it could further confirm that the worst may be behind us.
Could the rally in Bitcoin and altcoins see profit booking in the coming days? Let’s study the graphs to find out.
SPX
The S&P 500 reversed direction from the downtrend line on Jan. 18 and fell below the moving averages on Jan. 19, but the bears were unable to sustain the lower levels.
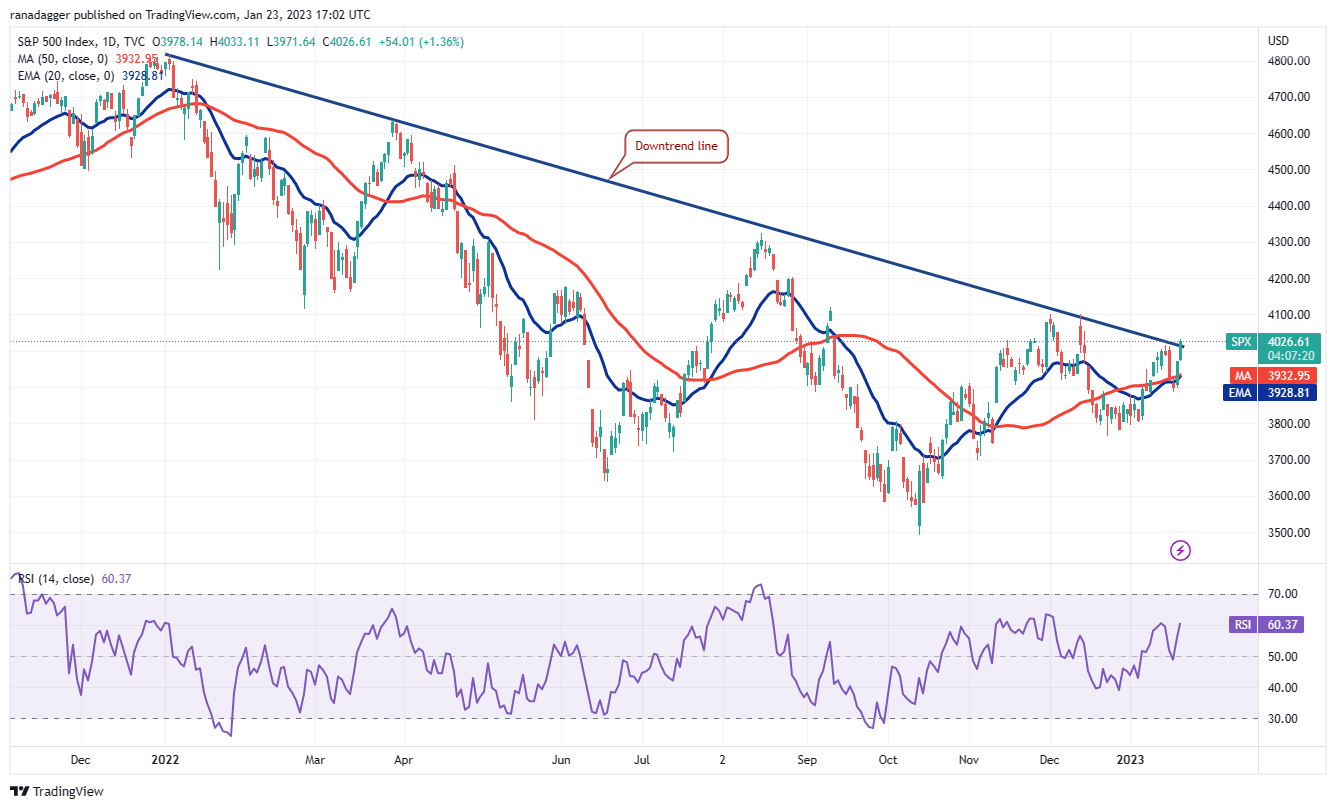
The bulls bought the dip on January 20 and pushed the price above the moving averages. Buyers built on this strength and are trying to clear the upper hurdle at the downtrend line on January 23. If they manage to do so, it will suggest a possible trend change. The index can skyrocket to 4,325 with a small pit stop at 4,100.
Contrary to this assumption, if the index fails to hold above the downtrend line, it will suggest that the bears are active at higher levels.
A break below 3885 could tip the short-term advantage in favor of sellers. The index can then drop to 3,764.
DXY
The US Dollar Index (DXY) continues in a downtrend. The buyers tried to initiate a rally on January 18, but the bears did not budge.
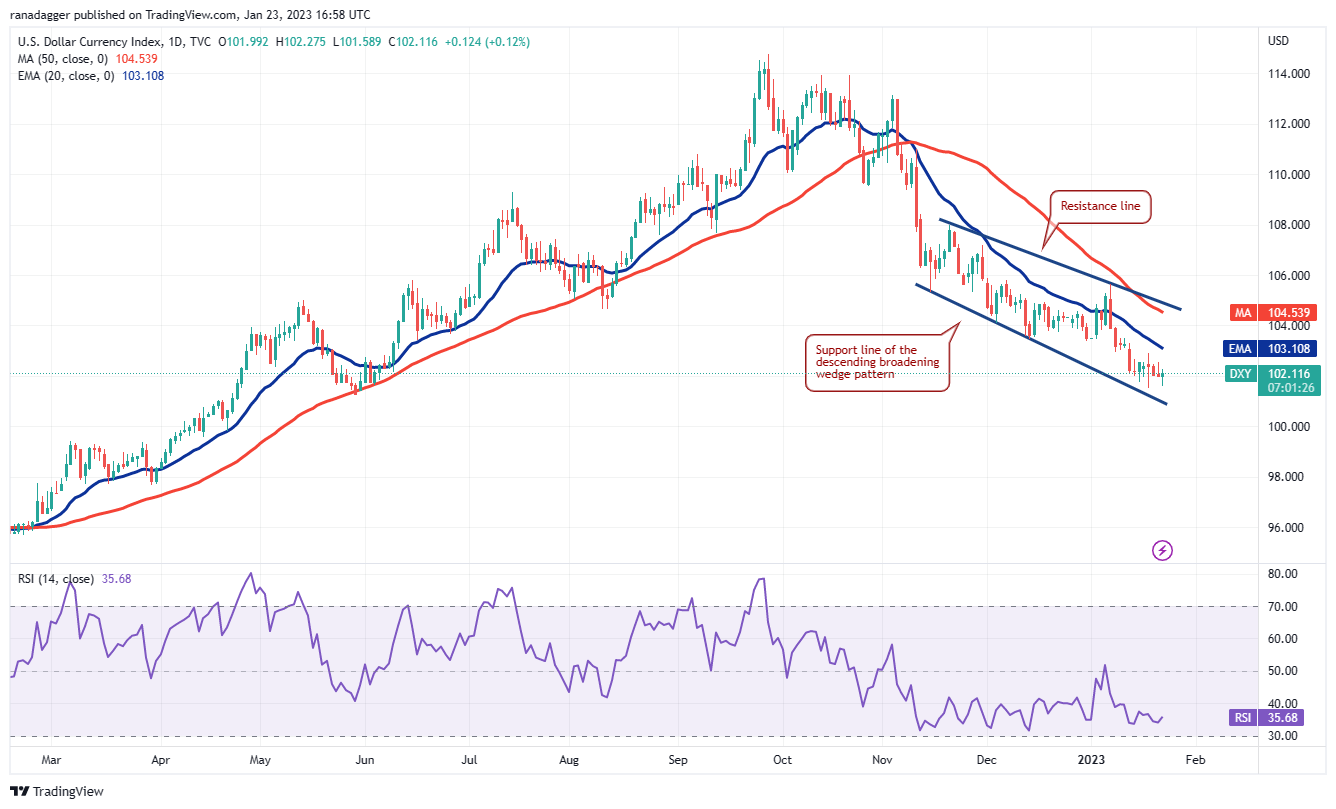
The falling moving averages and the RSI in the negative territory indicate that the bears are firmly in the driver’s seat. Buyers may try to defend the support line of the falling-widening wedge pattern, but could face heavy selling at the 20-day EMA (103).
On the downside, buyers are likely to protect the psychological 100 level because if this support breaks, the selling could intensify and the index could drop to 97.
The first sign of strength will be a break above the 20 day EMA. That could open the doors for a possible rally towards the resistance line of the wedge.
USDT/BTC
The bulls pushed Bitcoin above $22,800 on Jan. 21-22, but the long wick of the candlesticks shows that the bears are selling at higher levels. The bears tried to initiate a correction on January 22, but the bulls bought the intraday dip as seen from the long tail of the candlestick.
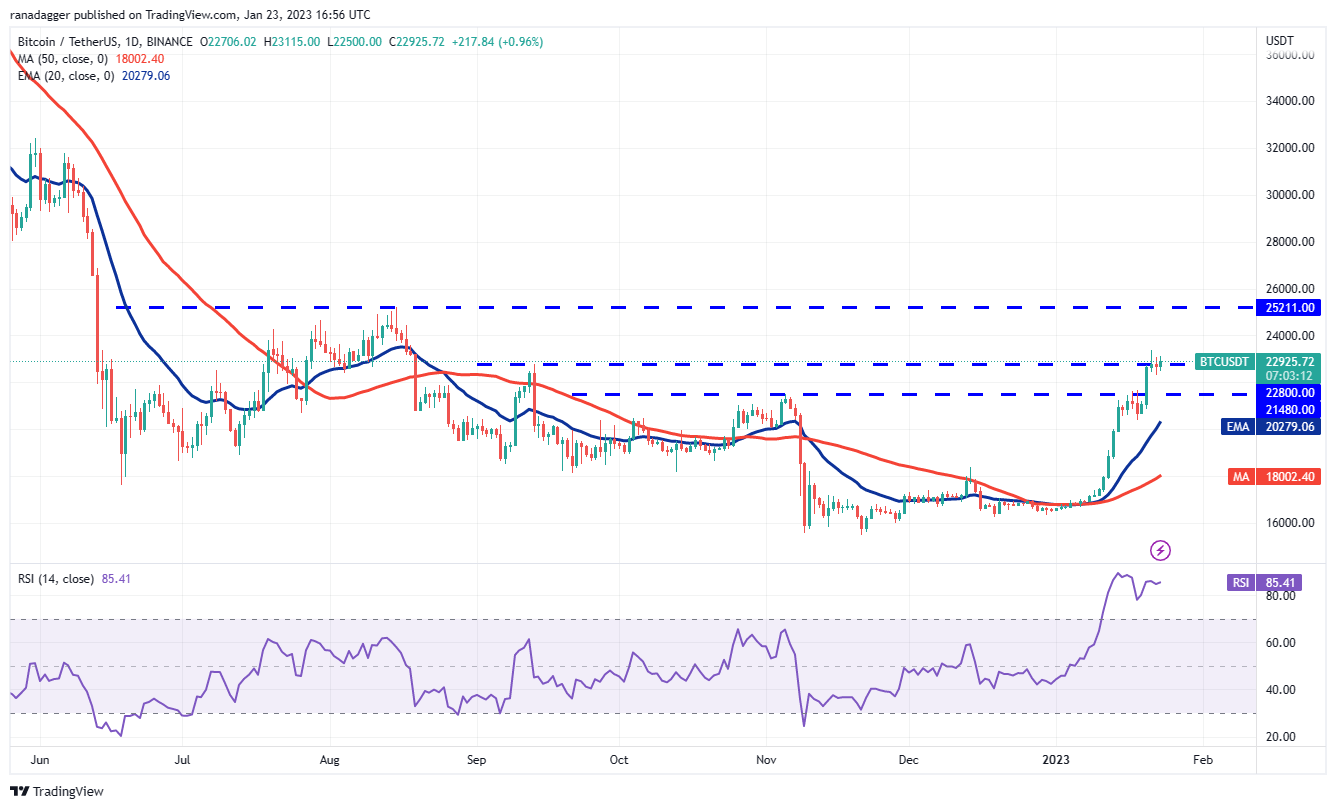
Although the rising moving averages indicate an advantage for buyers, the RSI in overbought territory warns that a minor correction or consolidation is possible. For that to happen, the bears will have to pull and hold the price below $22,292. The BTC/USDT pair could slide to $21,480.
Conversely, if the buyers push the price above the $23,078 to $23,371 resistance zone, the pair could accelerate to $25,211. The bears can mount a strong defense at this level, which could lead to a correction. short term.
EUR/USDT
Ether (ETH) price is facing a rejection of $1,680, but a positive sign is that the bulls have not given way to the bears. This suggests that short-term traders are holding their positions as they anticipate the bullish move to continue.
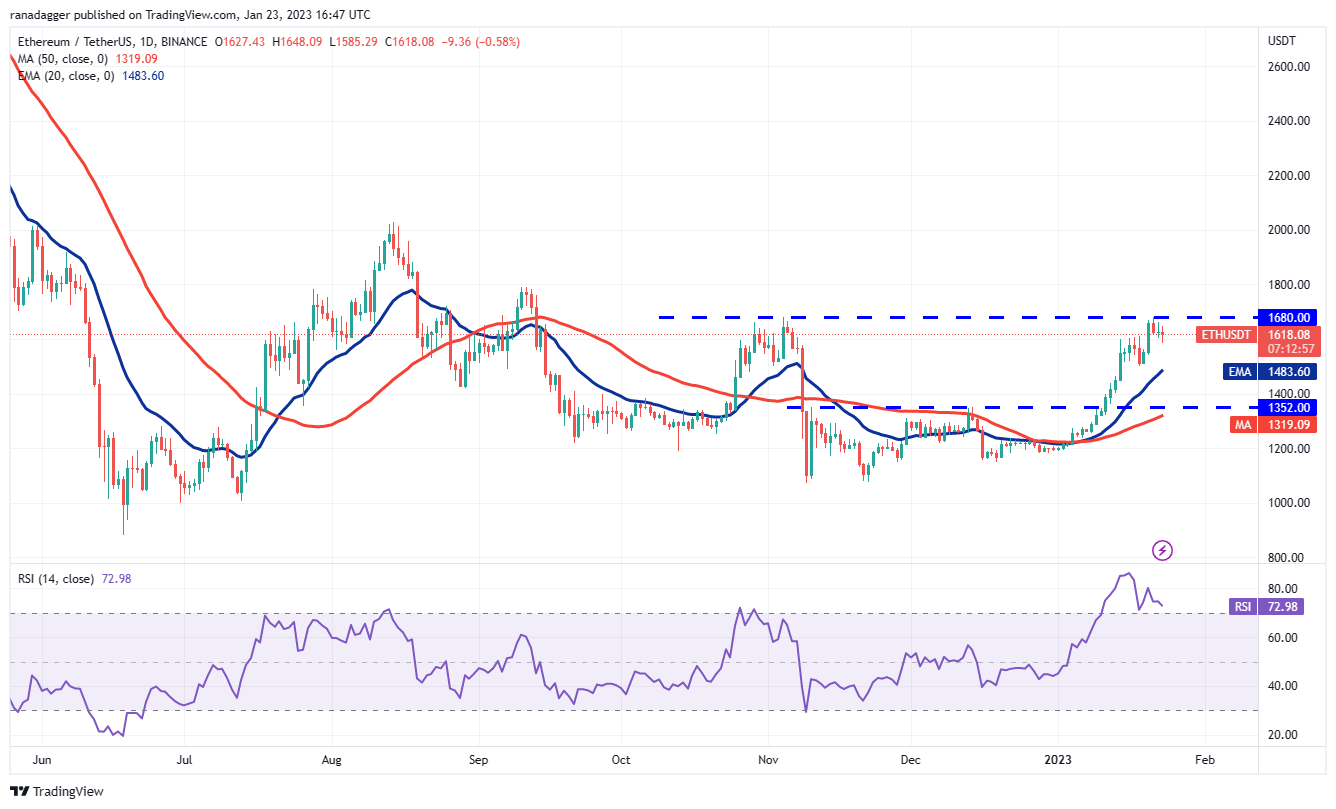
The rising 20-day EMA ($1483) and the RSI in the overbought territory suggest that the path of least resistance is to the upside.
A break and close above $1680 could start the trip to $1800. This level can again act as a resistance, but if the bulls do not allow the price to drop below $1680 during the next pullback, the probability of a rally to $2000 increases.
This positive view could be invalidated in the short term if the price turns down from the current level and breaks below the 20 day EMA. The ETH/USDT pair could remain range bound between $1,352 and $1,680 for some time.
USD/USDT
The BNB (BNB) relief rally is facing selling near the overhead resistance of $318, but the bulls have not given way to the bears. This suggests that the buyers are not rushing out as they expect the price to rally above $318.
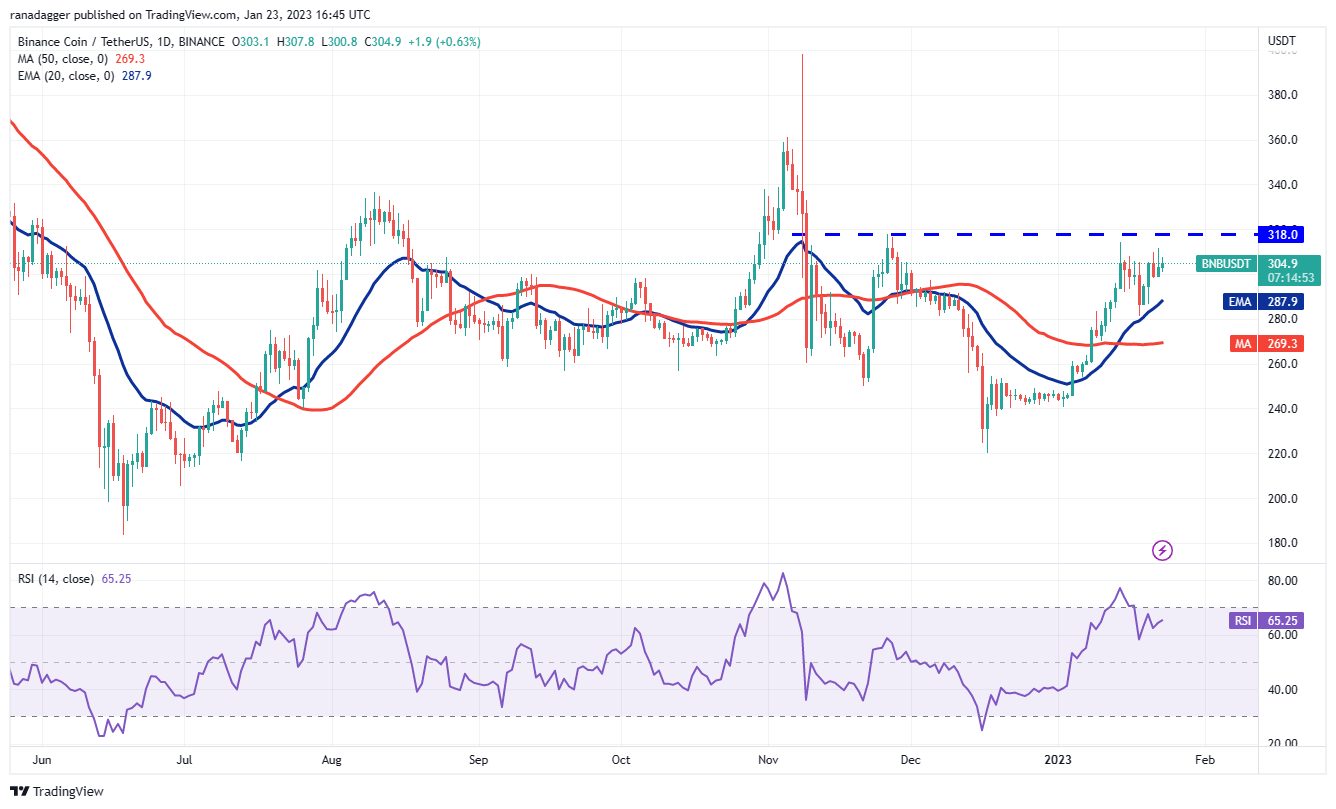
The rising 20-day EMA ($287) and the RSI in the positive zone indicate that the bulls have the upper hand. If the buyers push the price above $318, the BNB/USDT pair could accelerate to $360 as there is no major resistance in between.
If the price falls sharply from the current level, the pair could drop to the 20-day EMA. This level may attract strong buying by the bulls. If the price bounces off the 20-day EMA, the buyers will try again to clear the general hurdle of $318 and resume the uptrend. The short-term advantage could tilt in favor of the bears on a break below the 50-day simple moving average ($269).
USD/XRP
After a shallow two-day pullback, buyers pushed XRP (XRP) above the stiff upper resistance at $0.42 on Jan. 23. This indicates that every minor dip is being bought.
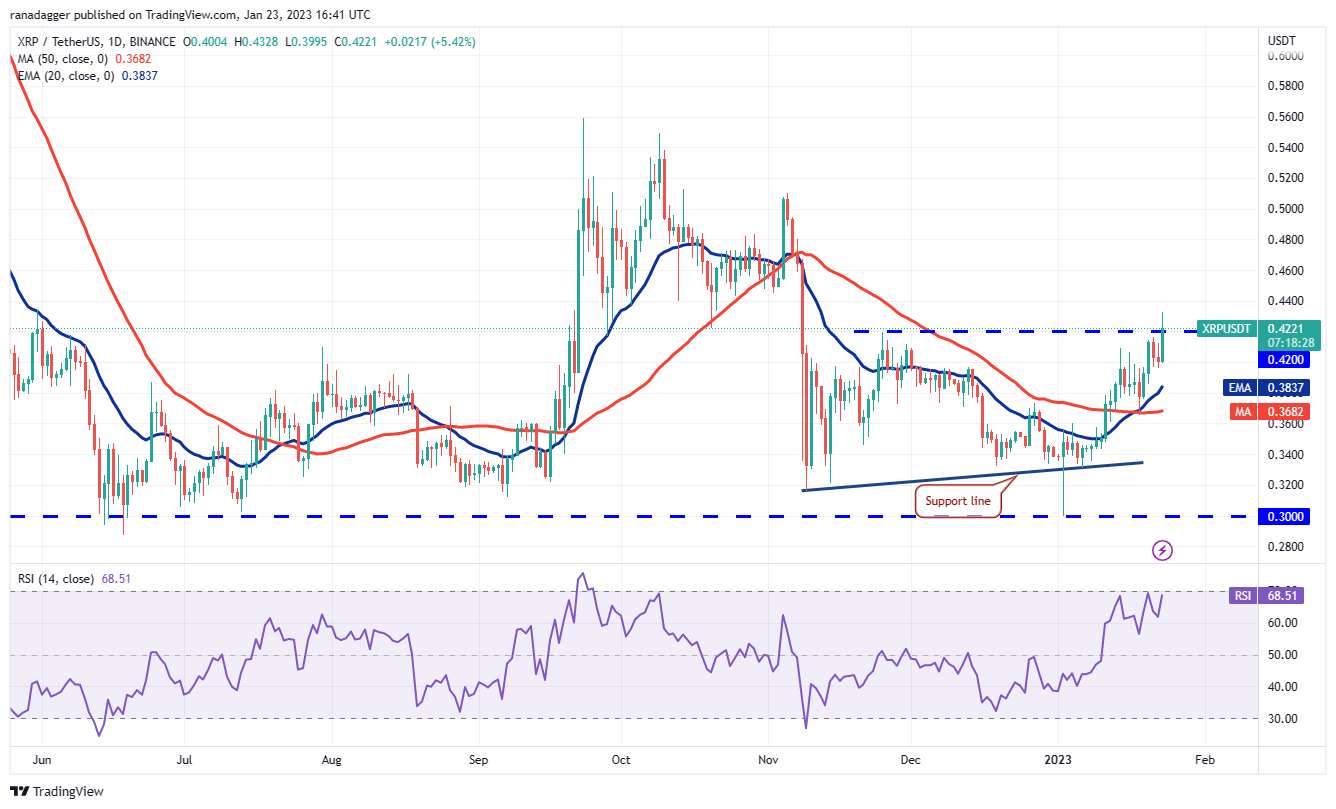
The 20-day EMA ($0.38) is sloping up and the RSI is close to the overbought region, indicating that the bulls are in control. However, the bears may not give up easily and will try to defend the $0.42 level with all their might because if this level gives way, the XRP/USDT pair could quickly jump to $0.51.
If the price fails to sustain above $0.42, the bears will try to push the pair below $0.39. If that happens, the possibility of a break below the 20 day EMA increases.
DOGO/USDT
Dogecoin (DOGE) continues to face selling above $0.09, but the bulls are unwilling to give up their effort.
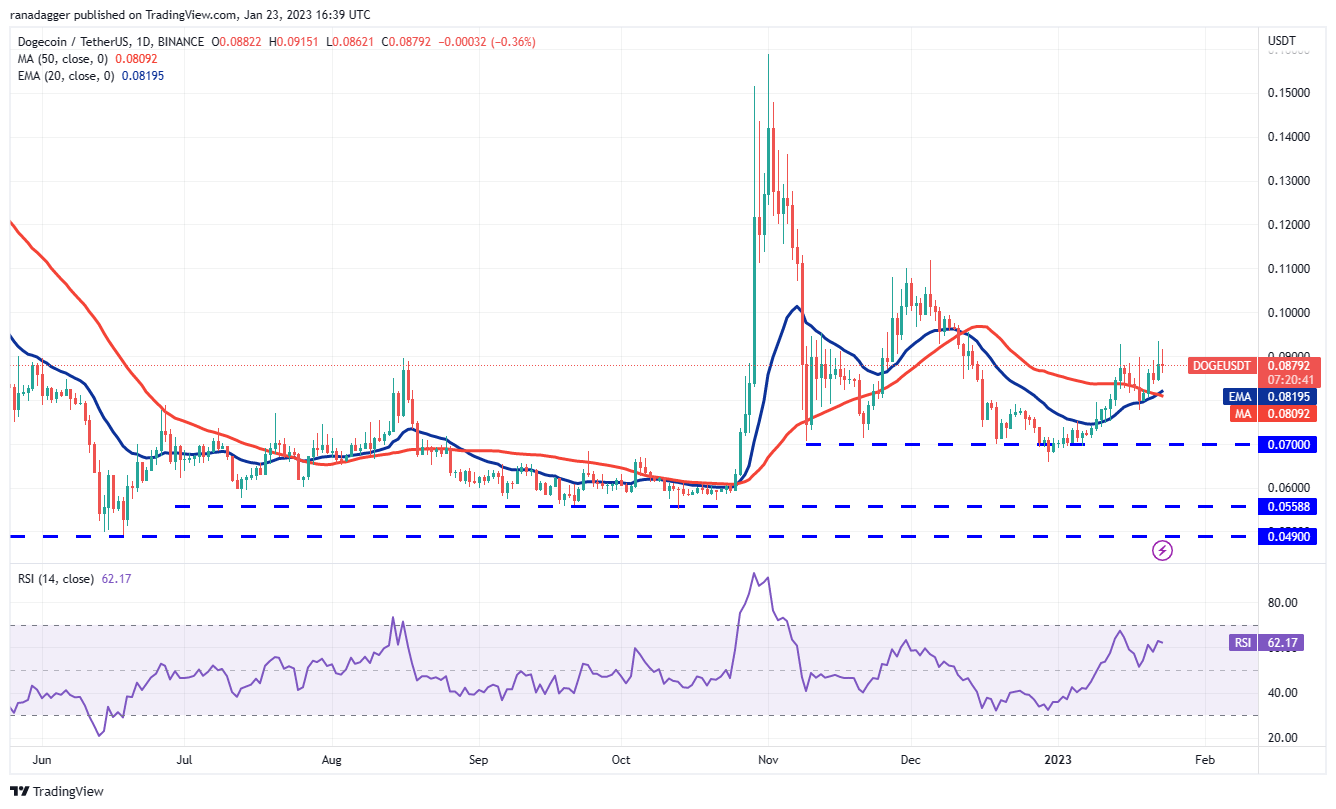
The moving averages have completed a bullish crossover and the RSI is in the positive territory, indicating an advantage for buyers. If the price sustains above $0.09, the DOGE/USDT pair could rally to $0.11. This level can act as a formidable barrier and the bulls may find it difficult to move higher anytime soon.
If the price fails to sustain above $0.09, short-term traders may book profits and that could sink the pair below the moving averages. Next, the pair may drop to the support near $0.07.
Related: 3 Sign Axie Infinity Price Risks Giving Up Its 135% Gains In January
ADA/USDT
Cardano (ADA) continues to gradually rise, but the bears are trying to stop the rally near $0.38. If the price turns down from the current level, it could drop to the 20-day EMA ($0.33).
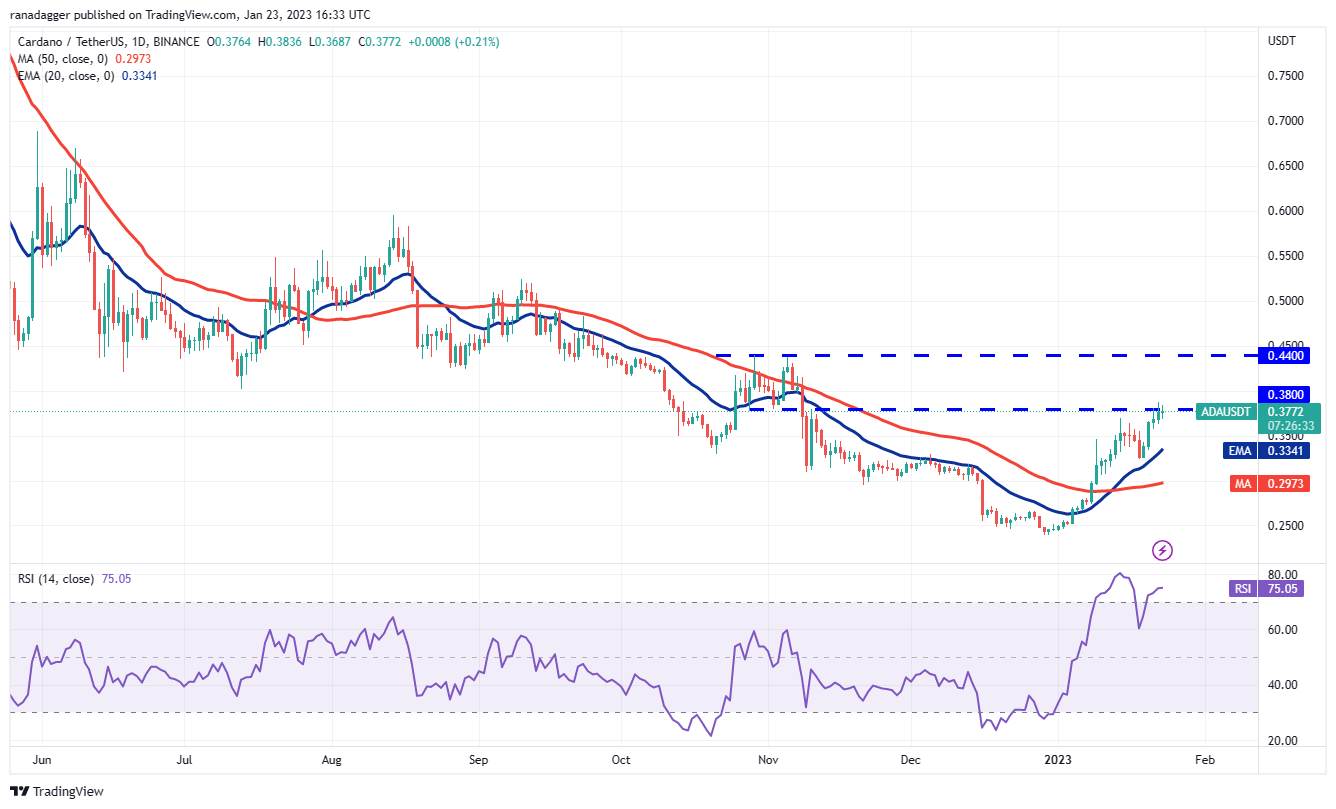
This is an important level to watch because a strong bounce off the 20 day EMA will suggest a shift in sentiment from selling on the rallies to buying on the dips. Then the bulls will make another attempt to break through the $0.38 barrier. If they succeed, the ADA/USDT pair could skyrocket to $0.44.
If the bears want to gain advantage in the short term, they will have to pull the price below the 20 day EMA. The pair could then drop to the 50-day SMA ($0.29).
MATIC/USDT
The bulls tried to push Polygon (MATIC) above the overhead resistance of $1.05 on Jan. 21, but the bears did not budge. Although the bears have successfully defended $1.05 over the past few days, they have not been able to pull the price below the 20-day EMA ($0.93).
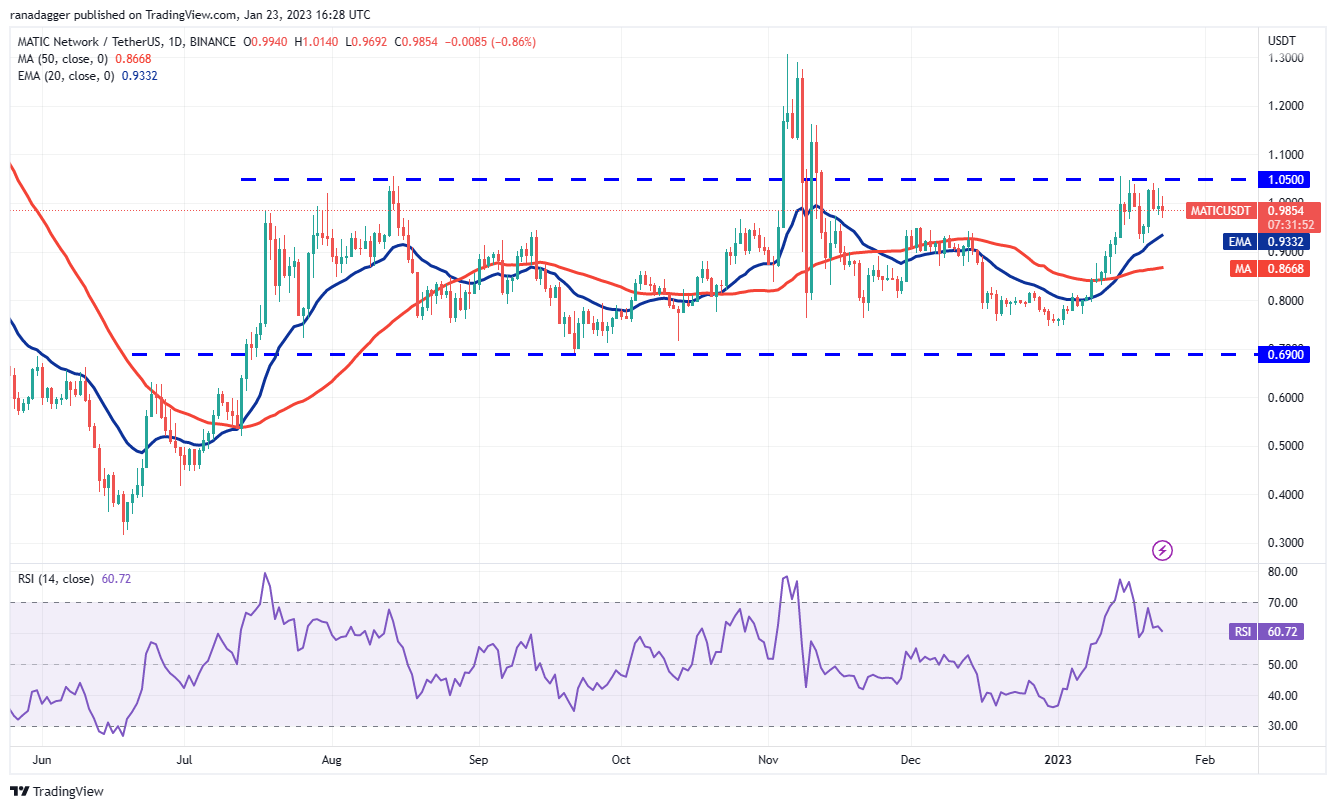
The rising 20 day EMA and the RSI in the positive zone suggest that the bulls have a slight advantage. Retesting a resistance level tends to weaken it. If the price rises from the current level, the prospects of a break above the overhead resistance improve. The MATIC/USDT pair could jump to $1.16 and then $1.30.
Conversely, if the price turns down from the current level, the bears will spot an opportunity and try to drag the pair below the 20-day EMA. If they can pull it off, the pair may remain trapped within the $0.69 to $1.05 range for a while longer.
POINT/USDT
Polkadot (DOT) formed a Doji candlestick pattern on January 21 and 22, indicating indecision between bulls and bears about the next move.
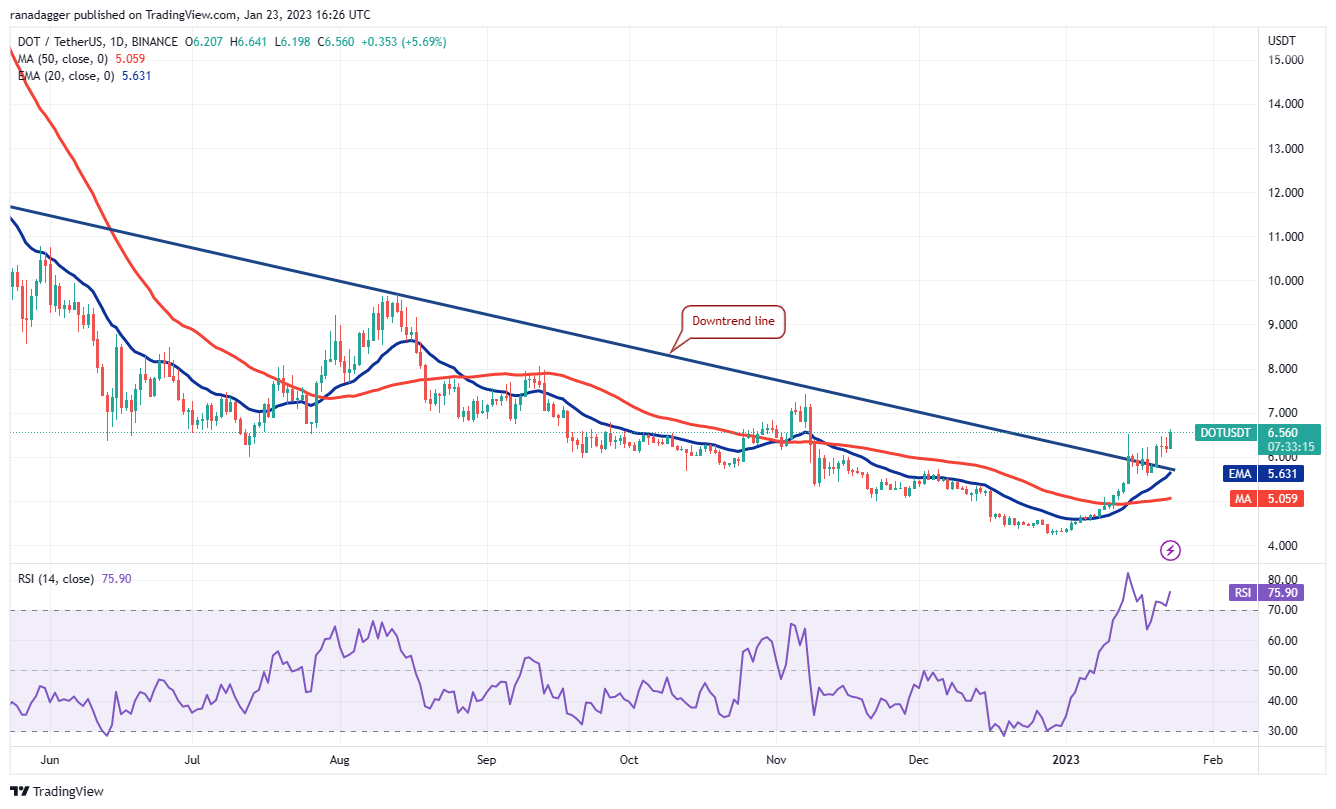
That uncertainty was resolved to the upside on Jan. 23 with a break above $6.50. If the buyers hold the price above this level, the DOT/USDT pair could rally to $7.42 first and if this level is cleared, the rally could touch $8. The rising moving averages and the RSI in the overbought territory indicate that the bulls are in control.
The important level to watch on the downside is the 20-day EMA ($5.63). The sellers will have to push the price below this support if they want to turn back.
The views, thoughts and opinions expressed here are those of the authors alone and do not necessarily reflect or represent the views and opinions of Cointelegraph.
This article does not contain investment advice or recommendations. Every investment and trading move involves risk, and readers should do their own research when making a decision.


