 NEWSLETTER
The Bitcoin (BTC) price has followed a four-year cycle with back-to-back up and down trends occurring at somewhat measurable intervals. A closer look at Bitcoin’s long-term price action reveals that the lead up to the top and bottom of previous cycles are remarkably similar. What is more interesting is that the cycle from 2020 to 2021 shows signs of following the same pattern.
Independent Market Analyst, HornHarris, found that the period between bottom-to-top and top-to-bot has been the same since 2015, 152 weeks and 52 weeks, respectively.
Even in 2013, the bear market lasted 58 weeks, only six weeks apart from the other two cycles.
Another resemblance to the latest bottom formation is the similarity between Bitcoin’s current uptrend and that of 2019, when the main catalyst was prevailing negative investor sentiment. Bitcoin price gained almost 350% from the bottom of $3,125 and did not fall below this level in the future, marking the bottom of the previous cycle.
Four years later, the conditions have changed, but the underlying reason for the latest 30% increase in Bitcoin’s price was still that the market expected lower prices due to macroeconomic headwinds. The lack of positive sentiment and the accumulation of short positions in the futures market may have allowed buyers to stage a rally of disbelief to seek short order liquidations and incite FOMO among investors who had been sitting on the sidelines.
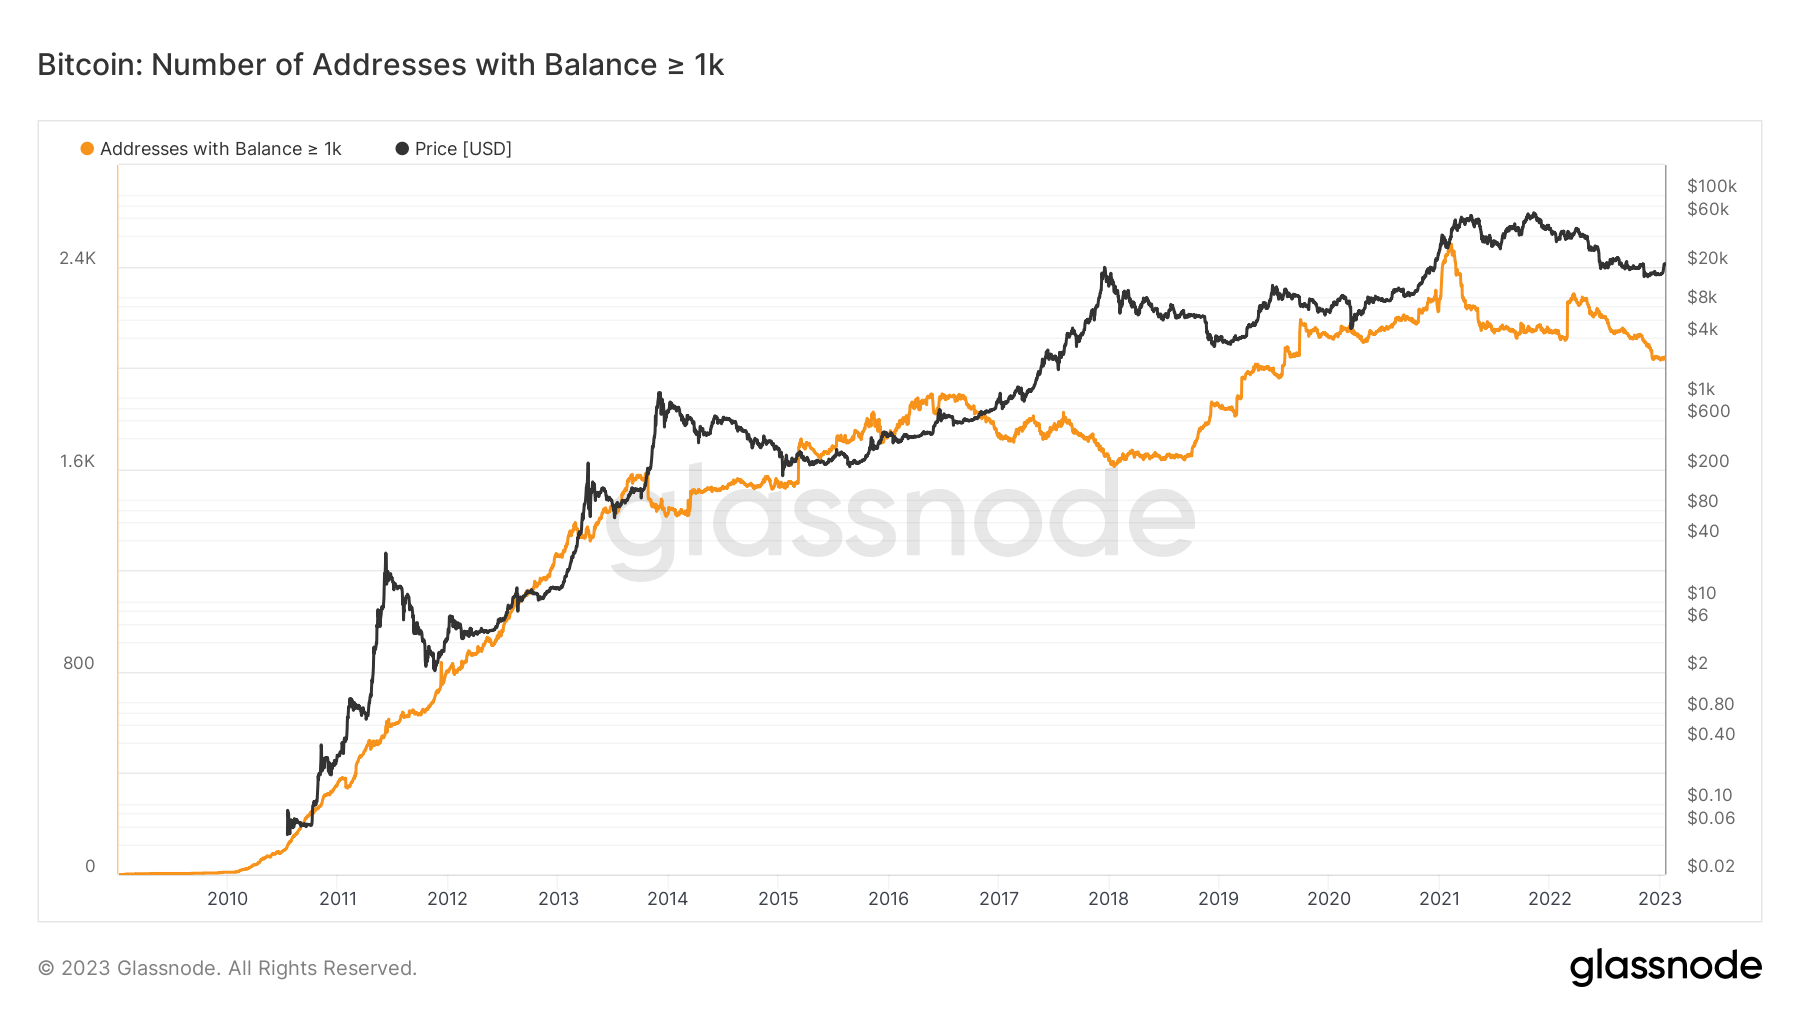
But not all conditions are equal. Previously, BTC whales, addresses that held more than 1,000 BTC, went shopping when the Bitcoin price began to bottom out. However, these buyers have not participated in the recent rally, raising concerns about its sustainability.
If history repeats itself, Bitcoin’s November 2022 lows of around $15,500 will mark the end of the current cycle. It would also mean that a new bullish cycle has begun and the asset could record a new peak in October 2025.
It will be interesting to see if whale buyers buy into the theory of the Federal Reserve under Jerome Powell achieving a successful soft landing rather than a recession as a result of its flight against inflation. December economic data on consumer price inflation and employment figures showed early signs of macroeconomic improvement. Some other on-chain indicators could help confirm if this bull run is real.
Signs of short-term bullish reversal appear
Bitcoin has been trading at buy-bid levels for quite some time on the longer time frames. However, in the short term, the risk of the price falling to new lows was high due to selling pressure from miners, macroeconomic headwinds and fears of FTX contagion. The recent rally shows signs of chain signals moving into bullish territory.
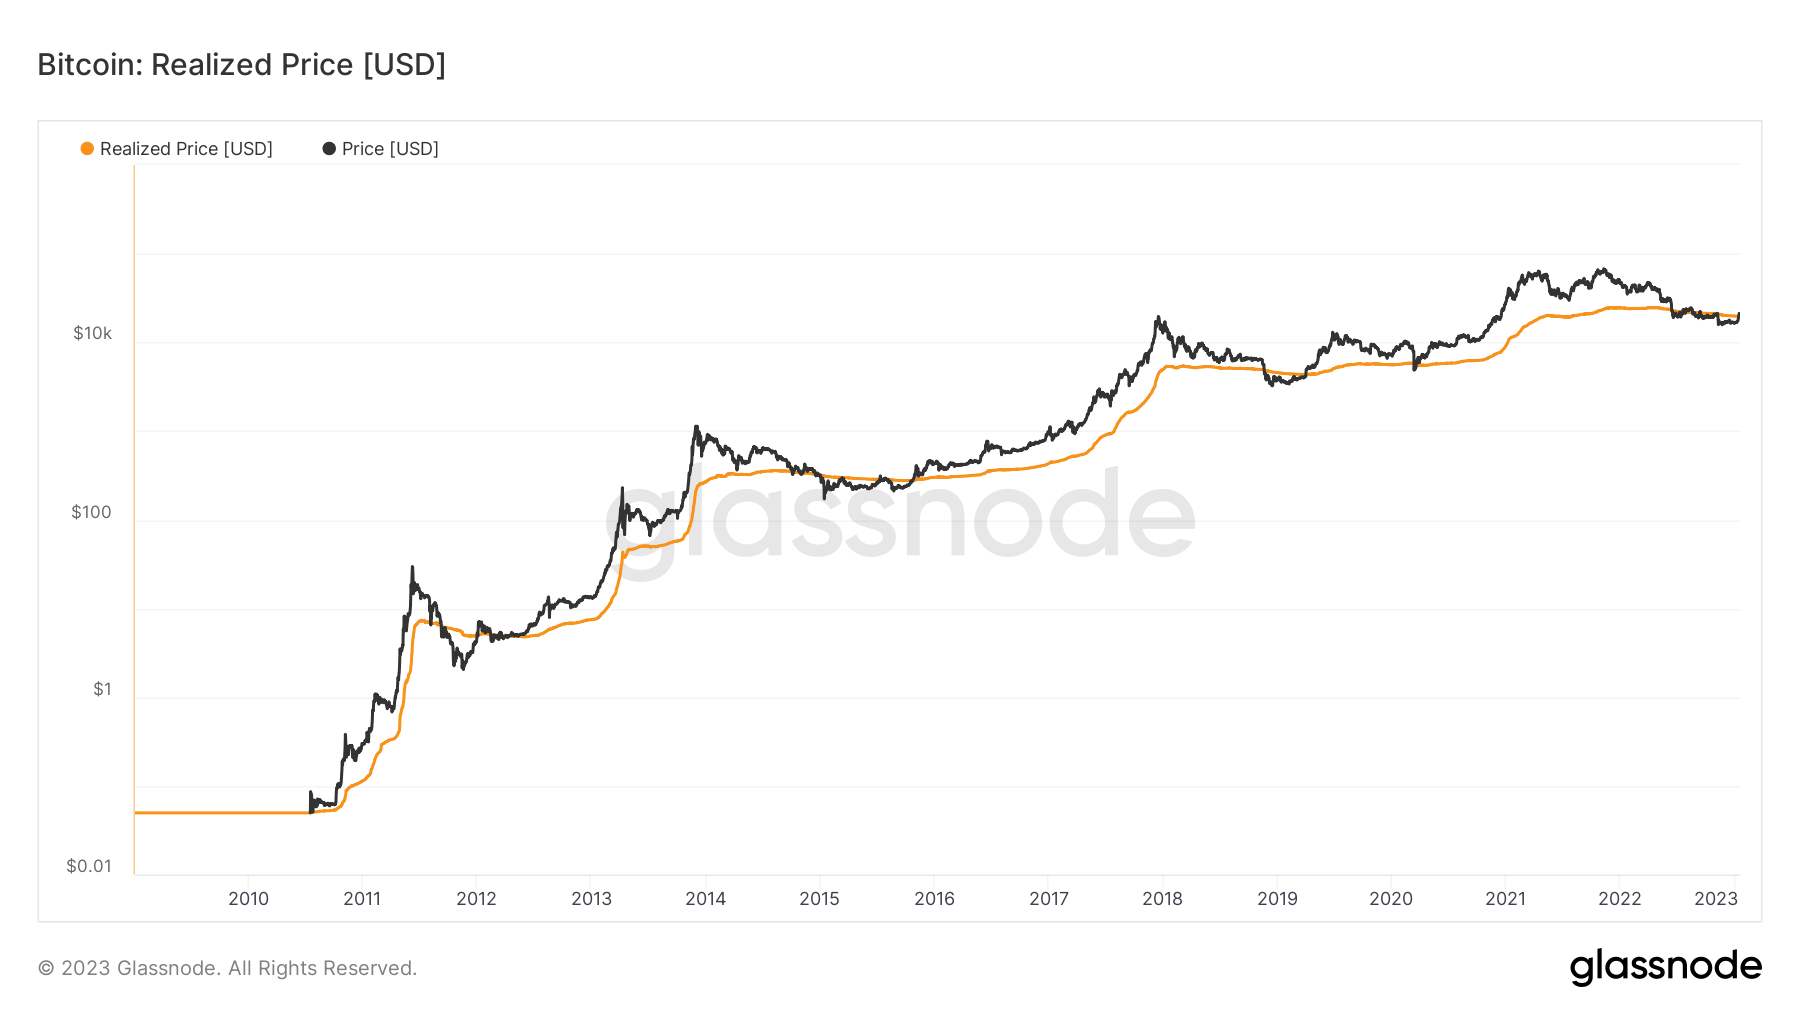
Bitcoin’s realized price metric reflects the average price of buyers moving coins around on-chain. Its price fell below its realized price only three times in the past eight years. Furthermore, a break above this level has marked the end of the downtrend in each of them.
Currently, the realized price of Bitcoin sits at $19,715. If the price sustains above this level, it will encourage buyers to join the rally.
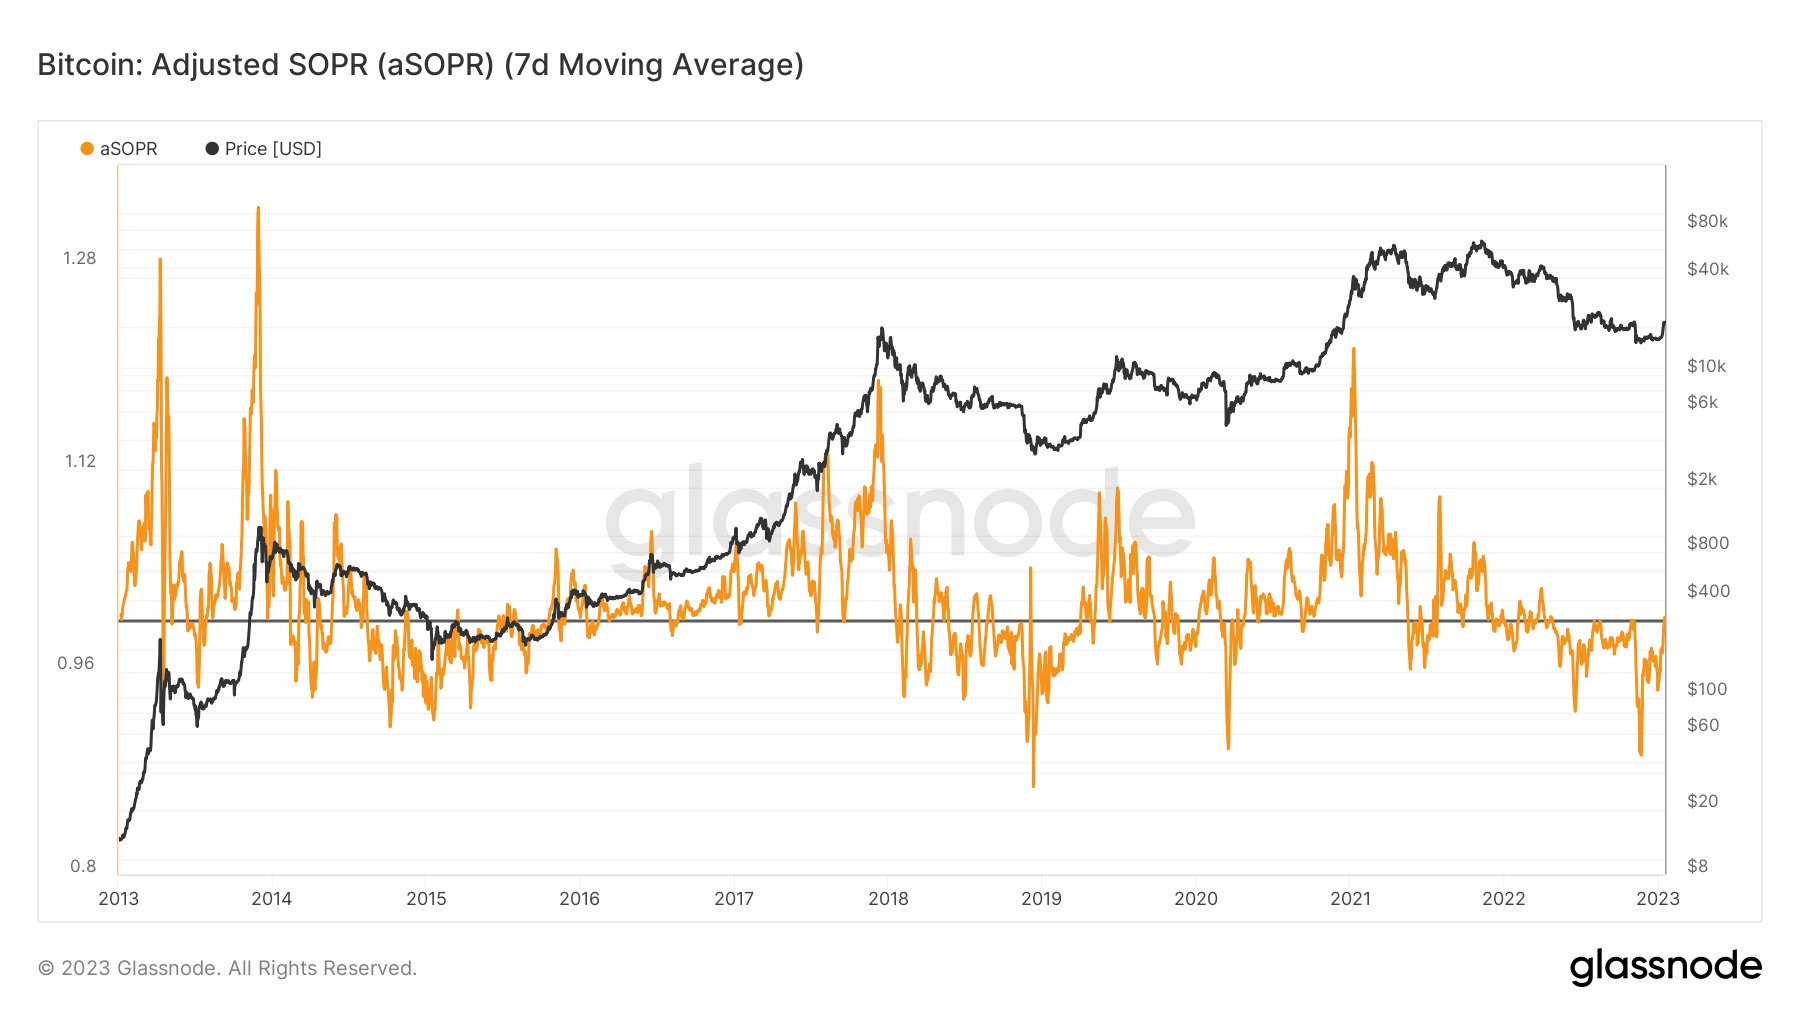
The indicator is used to identify bullish and bearish trends. When the price is in an uptrend, investors increase their winning positions during retracements, which are indicated when the value of the SOPR indicator stays above one. The opposite happens in a bear; bears dominate the market by selling rallies. Therefore, a metric crossing above the pivot by one is a strong trend reversal signal.
So far, the 7-day average trades are still taking place at a loss, but the price is very close to turning bullish. According to the latest SOPR pivot retest, the bullish reversal will occur after a successful weekly close above $21,200.
Another reliable short-term indicator on the chain is the profit-to-expense ratio (SOPR). Measures the profitability of Bitcoin transactions based on the price of tokens when added to and withdrawn from specific addresses.
Another notable development has occurred with Bitcoin miners, who were one of the biggest sellers in 2022, as the market price fell below Bitcoin’s cost of production, putting pressure on them. However, the days of the capitulation of the miners are probably long gone.
The Hash Ribbon indicator developed by an on-chain analyst, Charles Edwards, sparkle a buy signal, suggesting an end to the declining hashrate trend with prices recovering above the costs of production for large and medium-sized companies.
Unless the price of Bitcoin falls below $20,000 in the near future, the market can expect miners to start accumulating Bitcoin rather than having to sell the entire amount to cover operating costs.
The stark similarities between previous Bitcoin cycles and the ongoing miner sell-off relief should help buyers build a long-term bullish support level.
However, the lack of buying whales and the price reversal from the SOPR pivot level around $21,200 raises some red flags that sellers may start to dominate again. The on-chain support level for buyers is around the realized price at $19,715.
The views, thoughts and opinions expressed here are those of the authors alone and do not necessarily reflect or represent the views and opinions of Cointelegraph.
This article does not contain investment advice or recommendations. Every investment and trading move involves risk, and readers should do their own research when making a decision.
Recommended.


![]()
![]()
![]()
![]()
![]()
![]()
![]()
![]()
![]()
![]()
![]()
![]()
![]()
![]()
![]()
![]()
![]()
![]()
![]()
