The hopeful optimism of Bitcoin (BTC) traders seemed to dissipate in the first week of March, as key on-chain metrics provided resistance.
Now the Bitcoin price is threatening a retest of the $22,000 level and a wave of short sellers would take profit if that happened. If the short sellers’ strike price hits, some analysts believe the price of Bitcoin could drop as low as $19,000.
A handful of analysts still project the price of BTC to reach $25,000 in the short term, on-chain data that highlights some reasons for price resistance at higher levels.
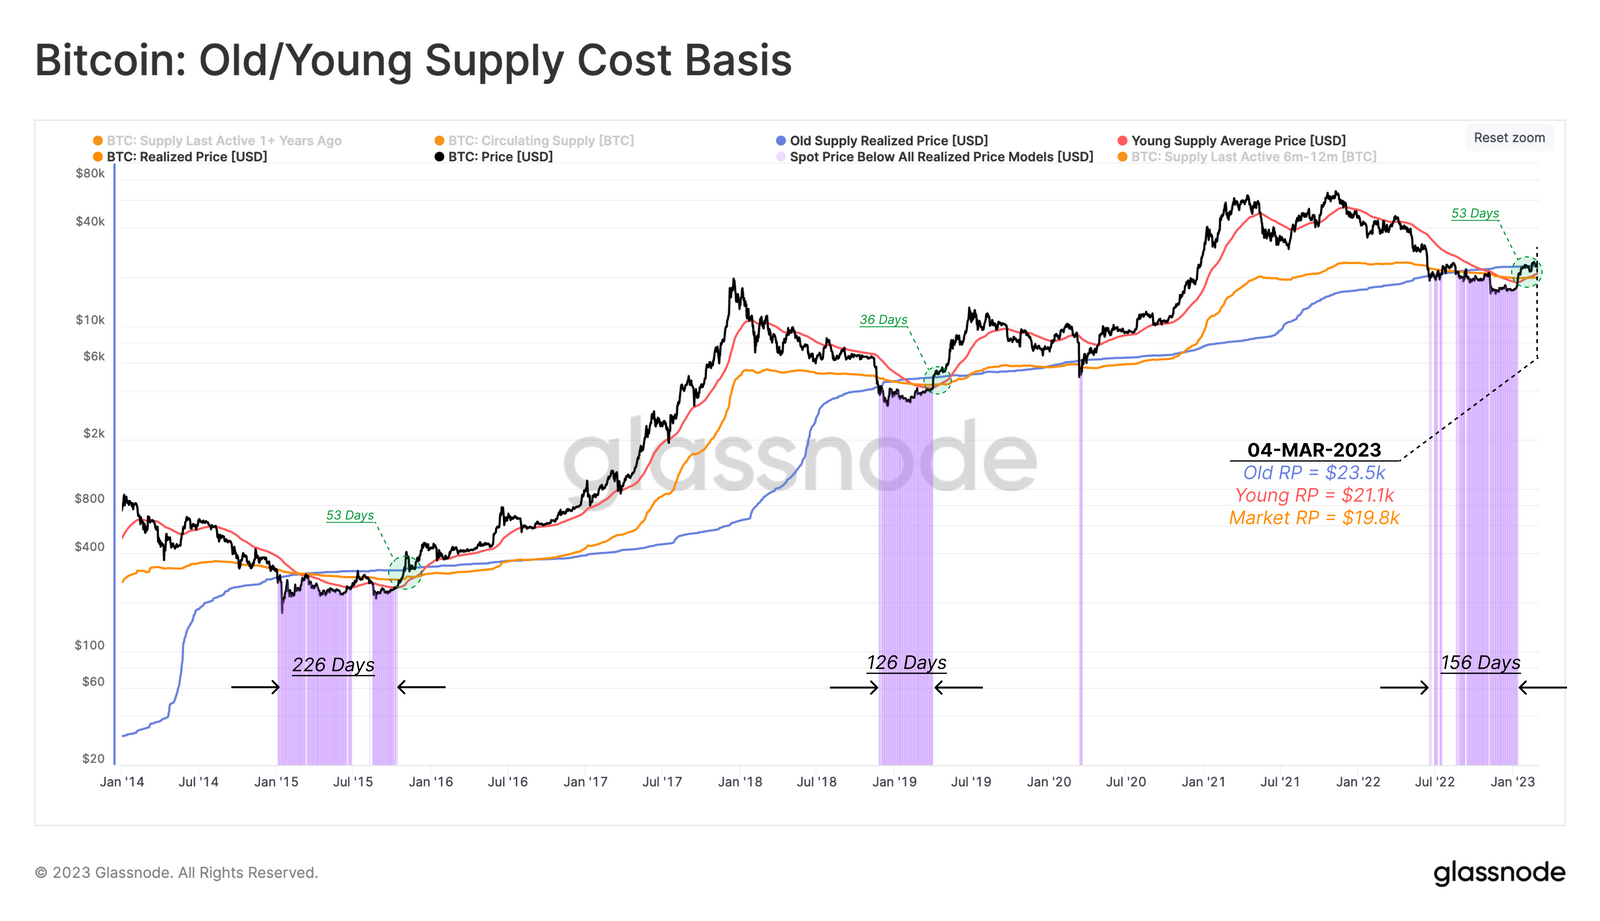
Realized price metric highlights profit taking
Market participants’ concerns over Federal Reserve interest rate hikes and high inflation are strong macroeconomic hurdles facing the Bitcoin price and this causes investors to weigh the time value of money of BTC investments. . To measure on-chain TVM, Bitcoin holders can be grouped based on the amount of time they held BTC and average the acquisition cost.
Investors who bought BTC in the last 6 months benefited from early bear market conditions and have an average realized price of $21,000, putting them in profit. The average price realized in the market among all BTC holders is $19,800, also currently in profit.
By contrast, BTC held for more than 6 months has a higher realized price than the rest of the market pools of $23,500. When Bitcoin reaches above $23,500, holders who have seen a small TVM return for more than 6 months potentially put pressure on a breakout as they fret for profit.

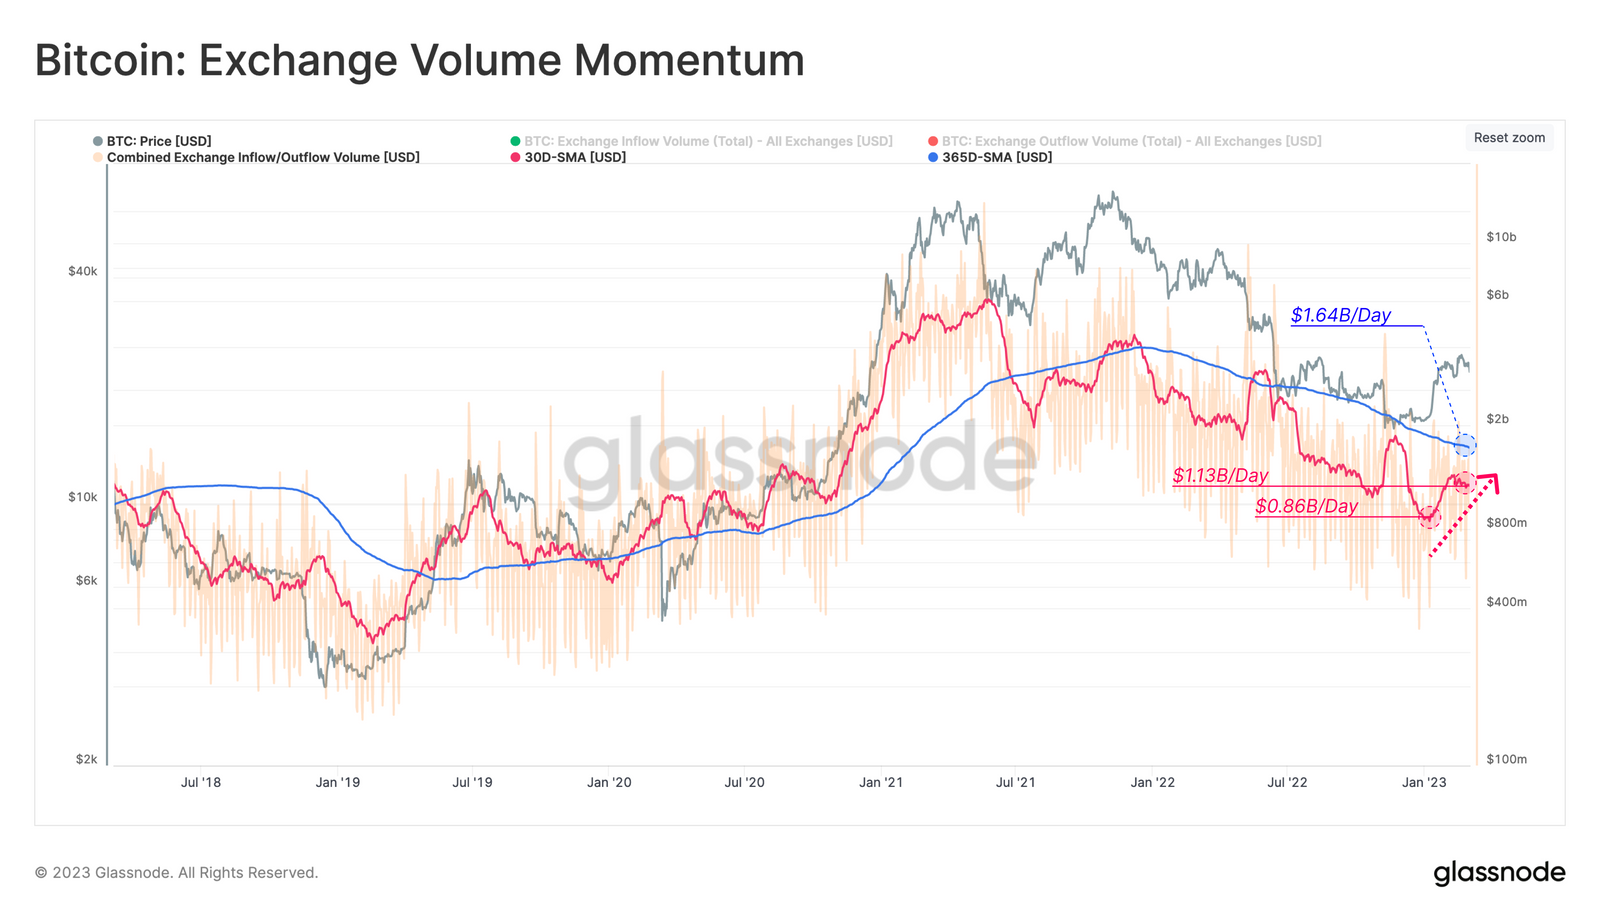
Liquidity inflows rise but pale compared to 2022
The Bitcoin price is highly reactive to interest rates and the US Dollar Index (DXY), putting pressure on risky assets. The negative impact of these factors is great for short sellers, but bad for the Bitcoin price. The best way for the Bitcoin price to withstand pressure from short sellers is for new cash and liquid buyers to enter the market.
Analyzing net trade flows is a good way to measure new liquidity, and this metric currently reflects a 34% increase since the beginning of 2023, but is behind the annual daily average of $1.6 billion.

Currently, the general consensus among analysts is that the ability to bring new liquidity into the cryptocurrency market has been hampered by the crackdown on banks that back crypto-oriented companies.
Rise in Bitcoin Unrealized Gains Reflects Previous Cycles
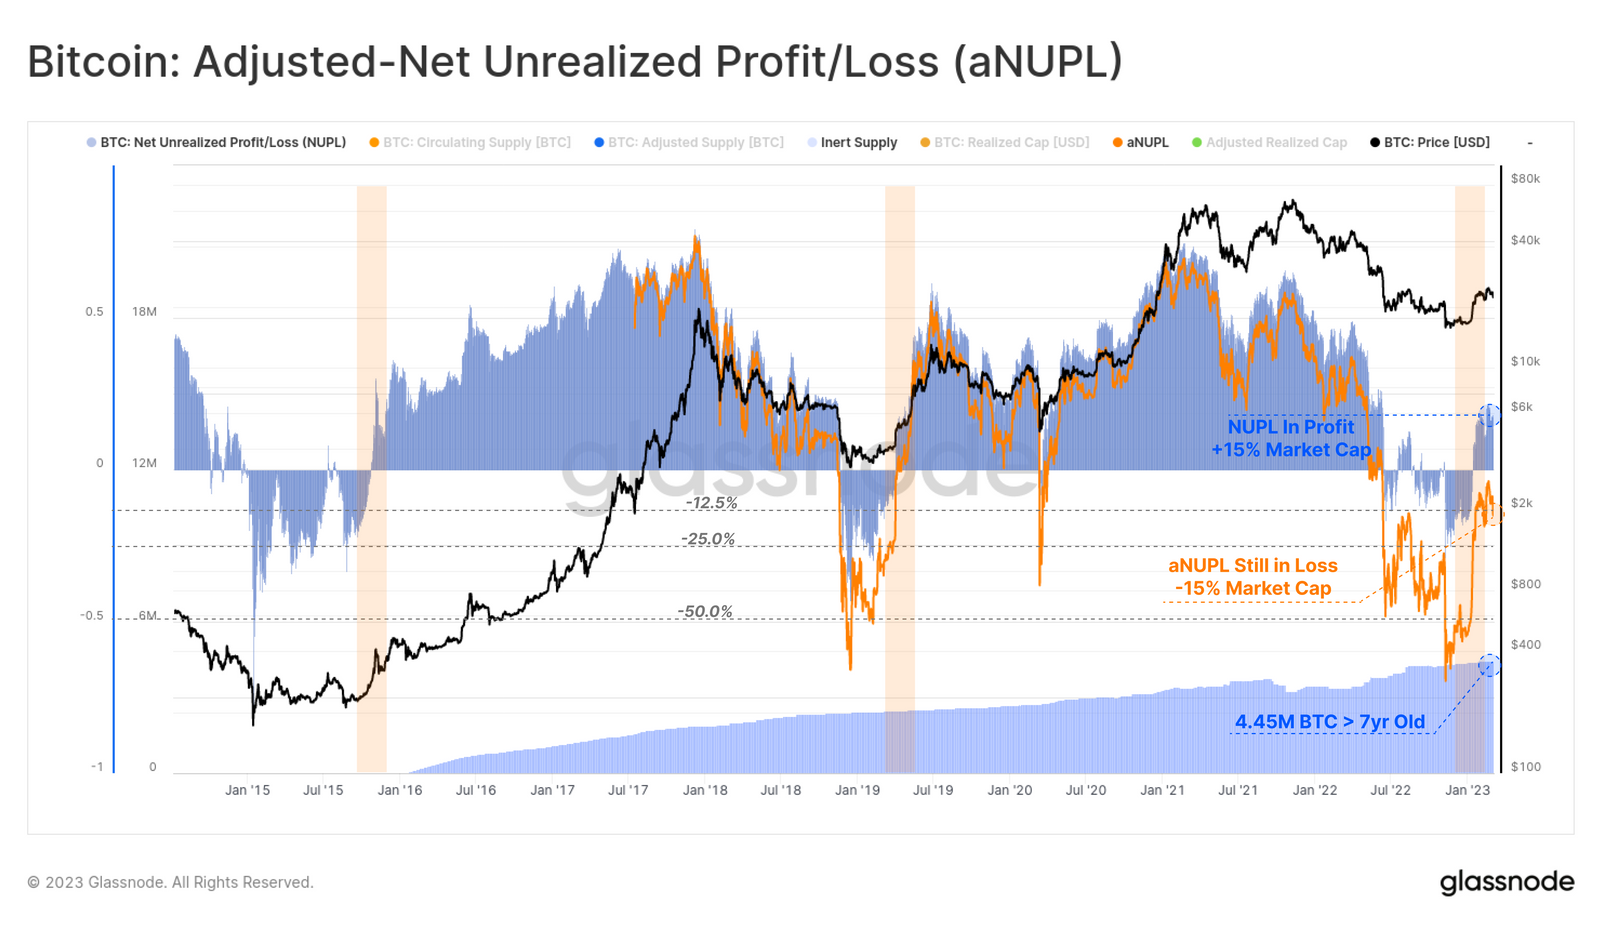
While some Bitcoin investors have made a profit, positive signs appear on-chain when looking at the Net Unrealized Profit/Loss (NUPL) metric. The NUPL metric shows the difference between the unrealized gain of Bitcoin and the unrealized loss within the BTC supply.
According to Glassnode, NUPL metrics on March 6 show:
“Since mid-January, the NUPL weekly average has moved from net unrealized loss status to positive condition. This indicates that the average Bitcoin holder now has a net unrealized gain of approximately 15% of the market capitalization. This pattern resembles a market structure equivalent to transition phases in previous bear markets.”

While Bitcoin’s 2023 momentum may have paused in mid-February and many headwinds remain, there are positive signs that the transition out of the deeper phase of the bear market is near.
The views, thoughts and opinions expressed here are those of the authors alone and do not necessarily reflect or represent the views and opinions of Cointelegraph.
This article does not contain investment advice or recommendations. Every investment and trading move involves risk, and readers should do their own research when making a decision.
![]()
![]()
![]()
![]()
![]()
![]()
![]()
![]()
![]()
![]()
![]()
![]()
![]()
![]()
![]()
![]()
![]()
![]()
![]()
 NEWSLETTER


