
Bitcoin (BTC) surged to its highest level in ten months on April 10 as traders await this week’s April 12 Consumer Price Index report for deeper insight into the Federal Reserve’s fight against rigid inflation. If the report shows that inflation is falling, it could be the next possible catalyst to further drive BTC higher.
On April 10, the price of BTC soared 3.37% to over $29,300 after a quiet Easter weekend. Interestingly, Bitcoin intraday gains appeared alongside a drop in US stocksa rare decoupling that highlights the declining risk characteristics of the coin.
Pre-IPC dynamics could be in effect
The Bureau of Labor Statistics will release March Consumer Price Index (CPI) data on April 12, which is expected to show inflation below 5.1% from 6.0% yoy previously.
A slowdown in headline CPI raises prospects for the Federal Reserve to shift in a more dovish direction. Conversely, lingering inflationary forces could lead traders to bet on more interest rate hikes in May.
Bitcoin’s rise above $29,000 suggests that cryptocurrency traders have been pricing in a drop in inflation, which, in turn, could lead to a potential Fed pivot.
However, the US Dollar Index (DXY), which tracks the dollar’s strength against a basket of major foreign currencies, rose 0.7% on April 10, which, coupled with a weaker US stock market, , shows that macro-investors expect a rate hike in the future.
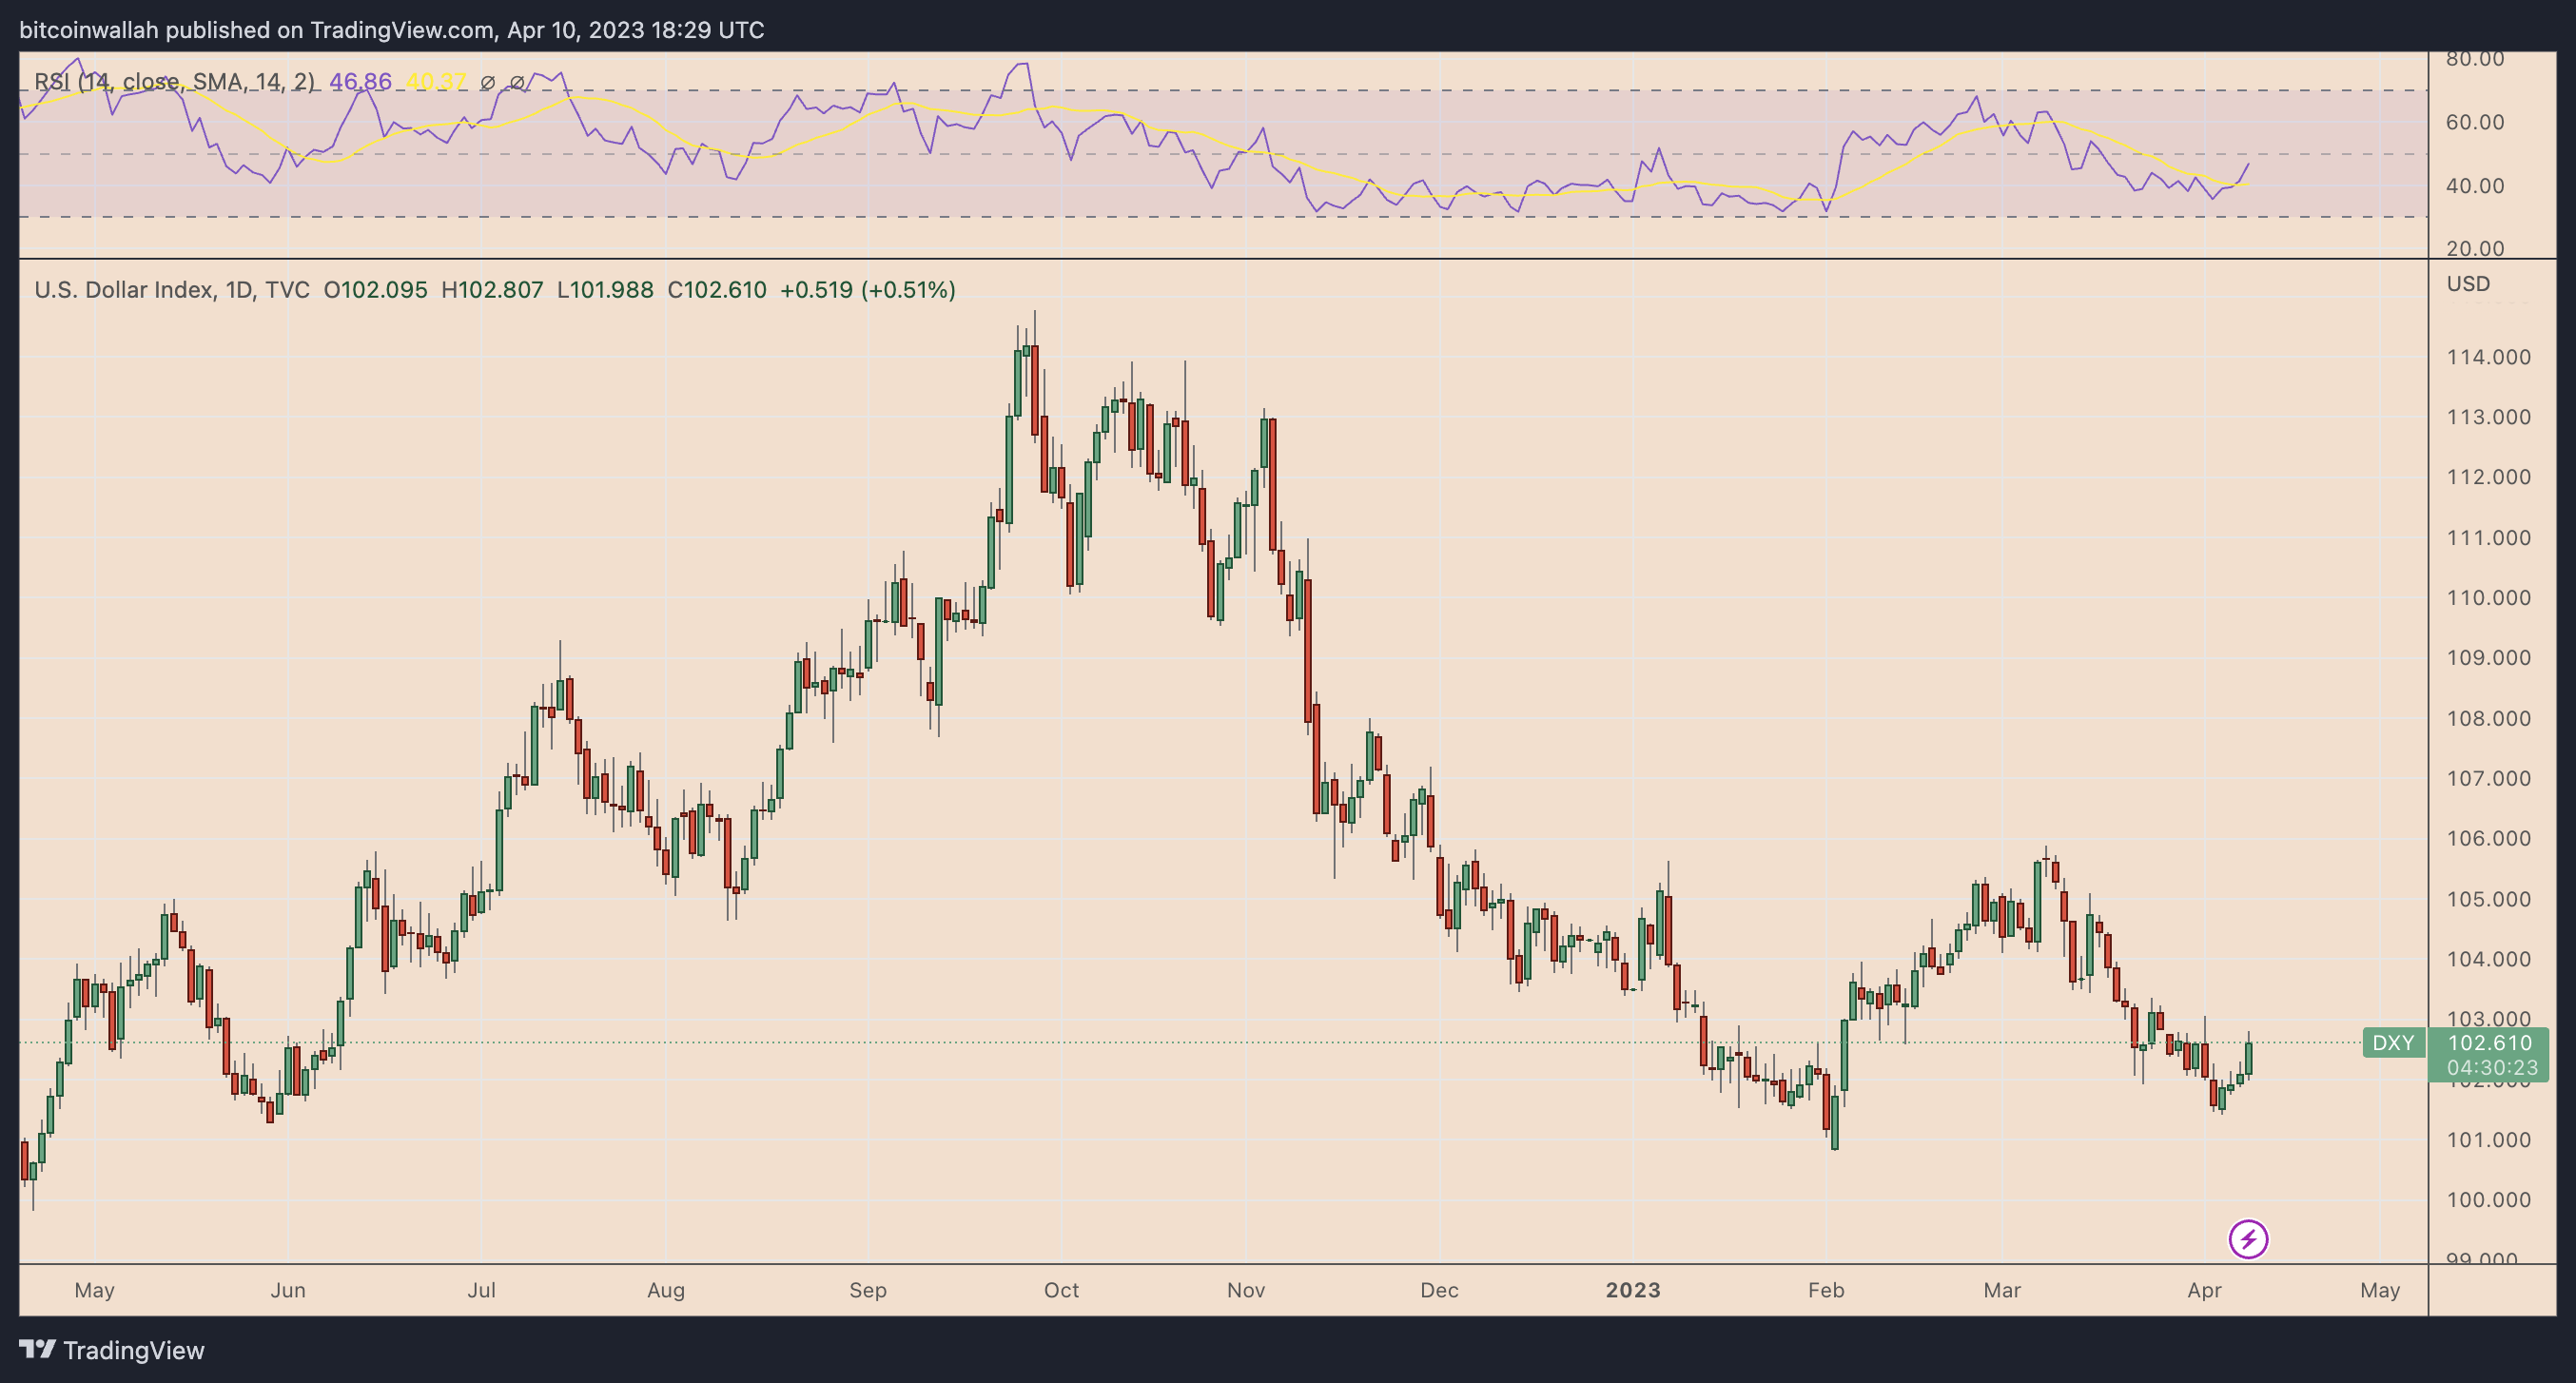
In fact, the market sees a 70% chance that the Fed will raise rates by 25 basis points at its May meeting, according to the CME Fed Watch Tool. That could be due to a tighter labor market giving the Fed more ammunition to continue raising interest rates in the future.
Could Bitcoin hit $30,000 in April?
From a fundamental perspective, Bitcoin appears poised to hit $30,000 ahead of the Fed’s FOMC. However, its likelihood of sustaining those gains will depend on inflation data, as mentioned above.
Related: IPC Will Cause a Dollar ‘Slaughter’: 5 Things to Know About Bitcoin This Week
Meanwhile, from a technical analysis standpoint, Bitcoin must close above its weekly resistance range, defined by the $29,500 to $32,000 area, to see a move towards $40,000.
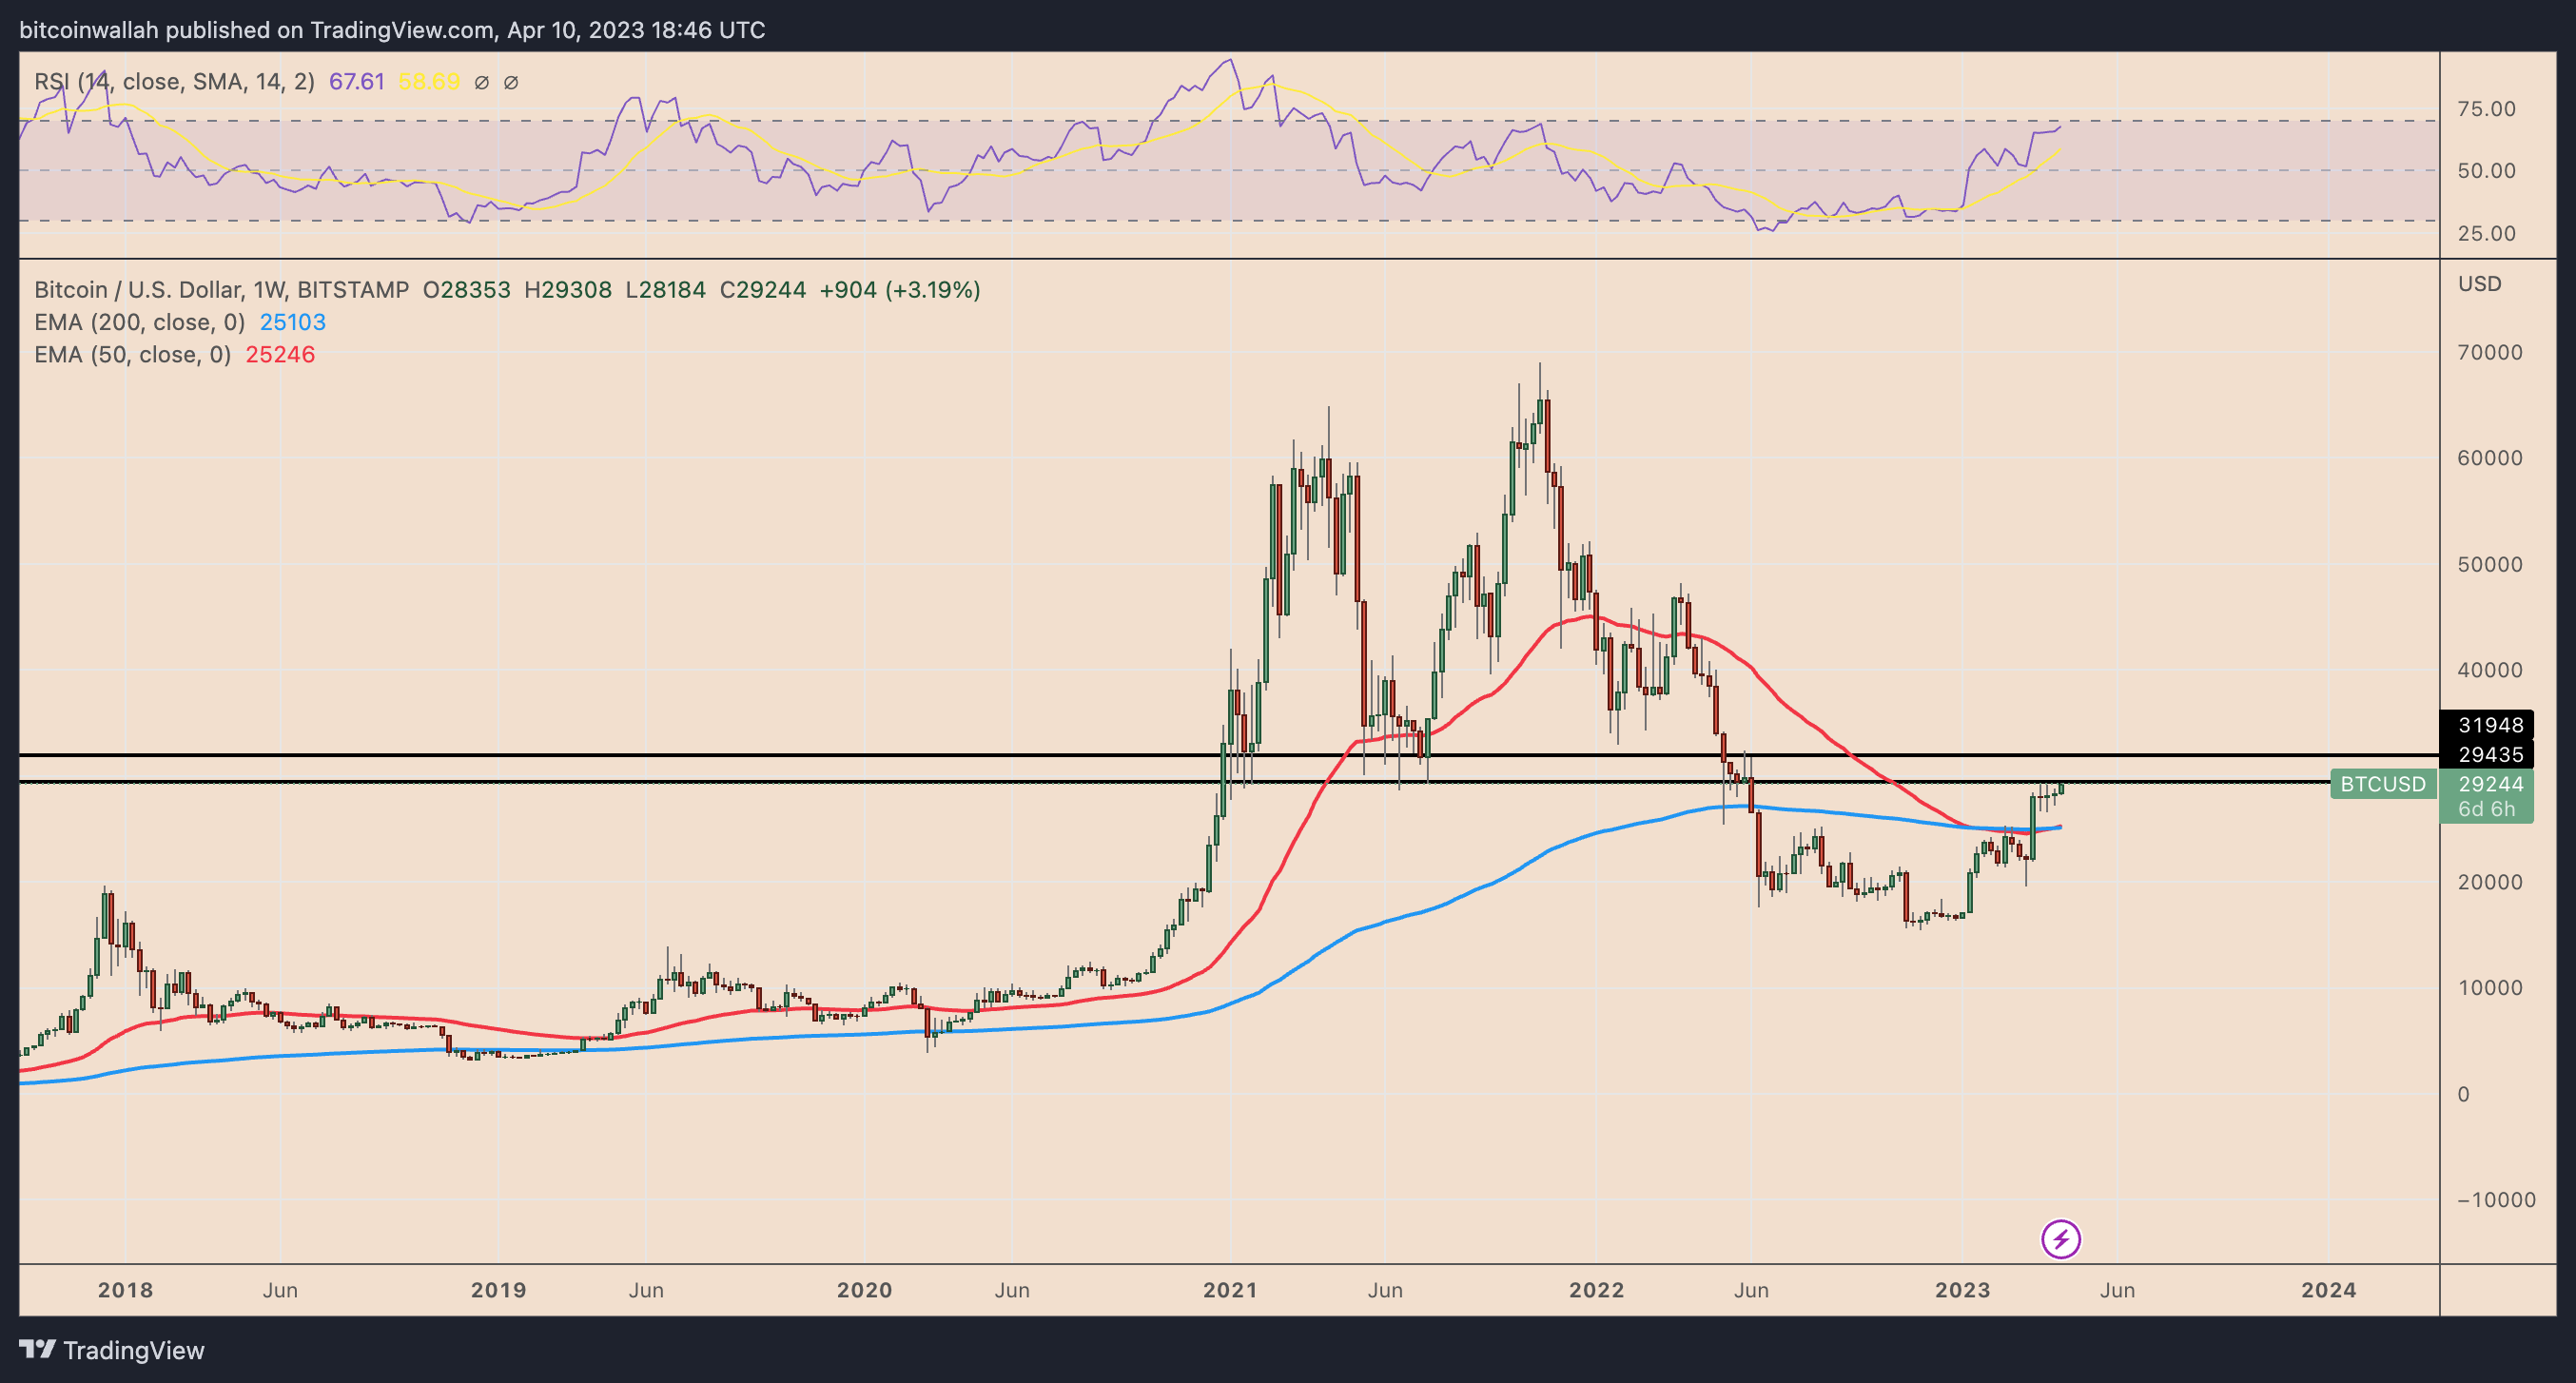
This range served as support in the sessions from December 2020 to February 2021, from May 2021 to July 2021, and from January 2022 to March 2022.
In the event of a pullback from the mentioned range, BTC price risks a sharp drop towards its 50-week exponential moving average (50-week EMA; the red wave) near $25,250 and its 200-week exponential moving average. (200 week EMA). ; the blue wave) about $25,000.
The views, thoughts and opinions expressed here are those of the authors alone and do not necessarily reflect or represent the views and opinions of Cointelegraph.
This article does not contain investment advice or recommendations. Every investment and trading move involves risk, and readers should do their own research when making a decision.


