
The long weekend has produced no fireworks for the Bitcoin (BTC) price, which continues to trade in an ever tighter range. Bitcoin is on track to form a third consecutive Doji candlestick pattern on the weekly chart. This suggests that Bitcoin bulls and bears are unclear on the next directional move.
It is not just Bitcoin that is stuck within a range. On April 7, Jurrien Timmer, director of global macro at asset manager Fidelity Investments, tweeted that the S&P 500 Index had been range bound for the past nine months and would break out “sooner or later.”
Bitcoin’s failure to break above the $30,000 level has attracted profit booking in several altcoins, but some have seen shallow pullbacks. This indicates that traders are holding on to their positions waiting for a bullish move.
Let’s study the charts of selected altcoins that may appear and start an uptrend if Bitcoin spikes. What are the resistance levels above which these five cryptocurrencies turn bullish?
Bitcoin Price Analysis
Bitcoin has been trading within a tight range for the past two days, indicating indecision between the bulls and the bears. Typically, tight ranges are followed by an expansion in volatility.
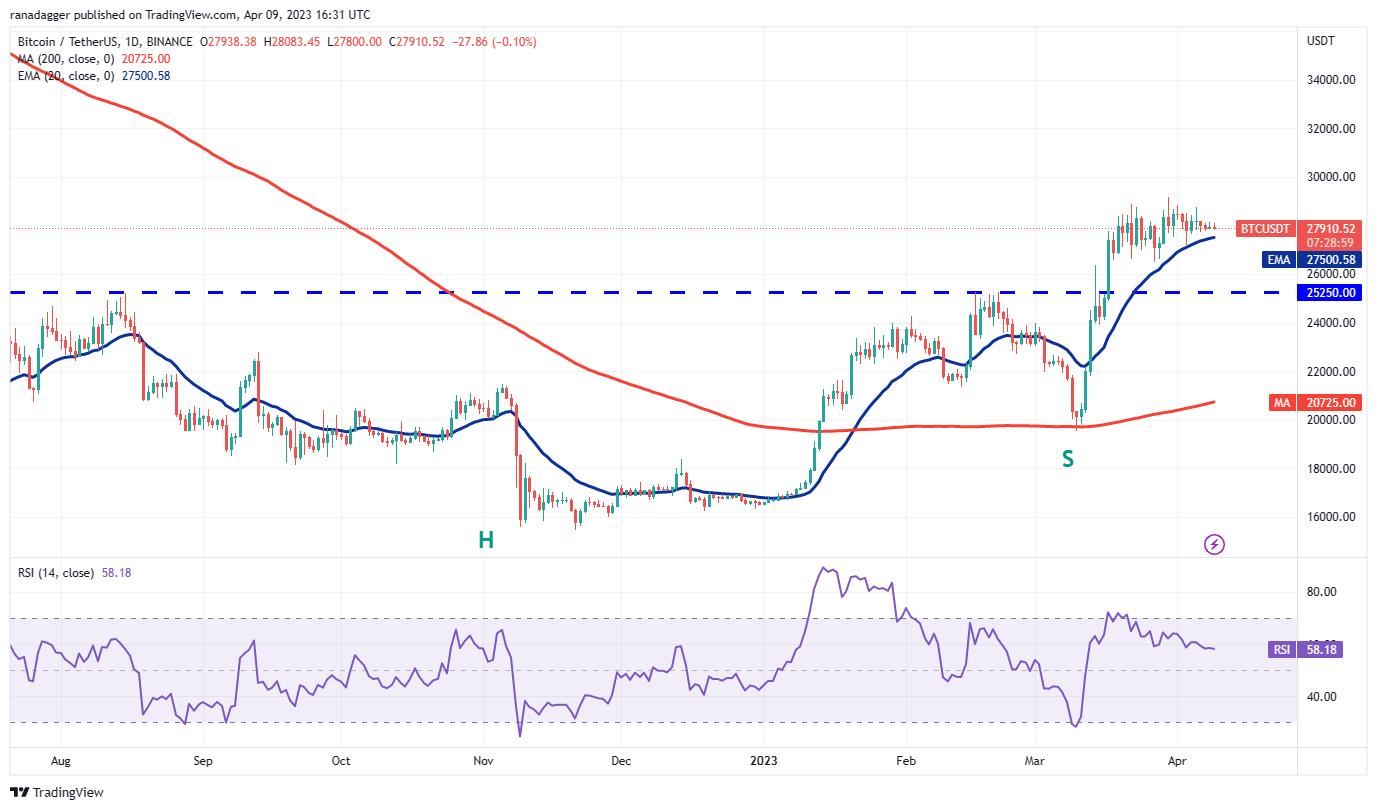
The 20-day exponential moving average ($27,500) is flattening out and the RSI has gradually slid towards the center. This suggests a balance between supply and demand.
If the price dips below the 20-day EMA, several short-term stops can be triggered and the BTC/USDT pair can plunge to the breakout level of $25,250.
Conversely, if the price bounces hard off the 20 day EMA, it will suggest that sentiment remains positive and traders are buying dips. A rally above $29,200 could improve prospects for a rally to $30,000 and subsequently $32,500.
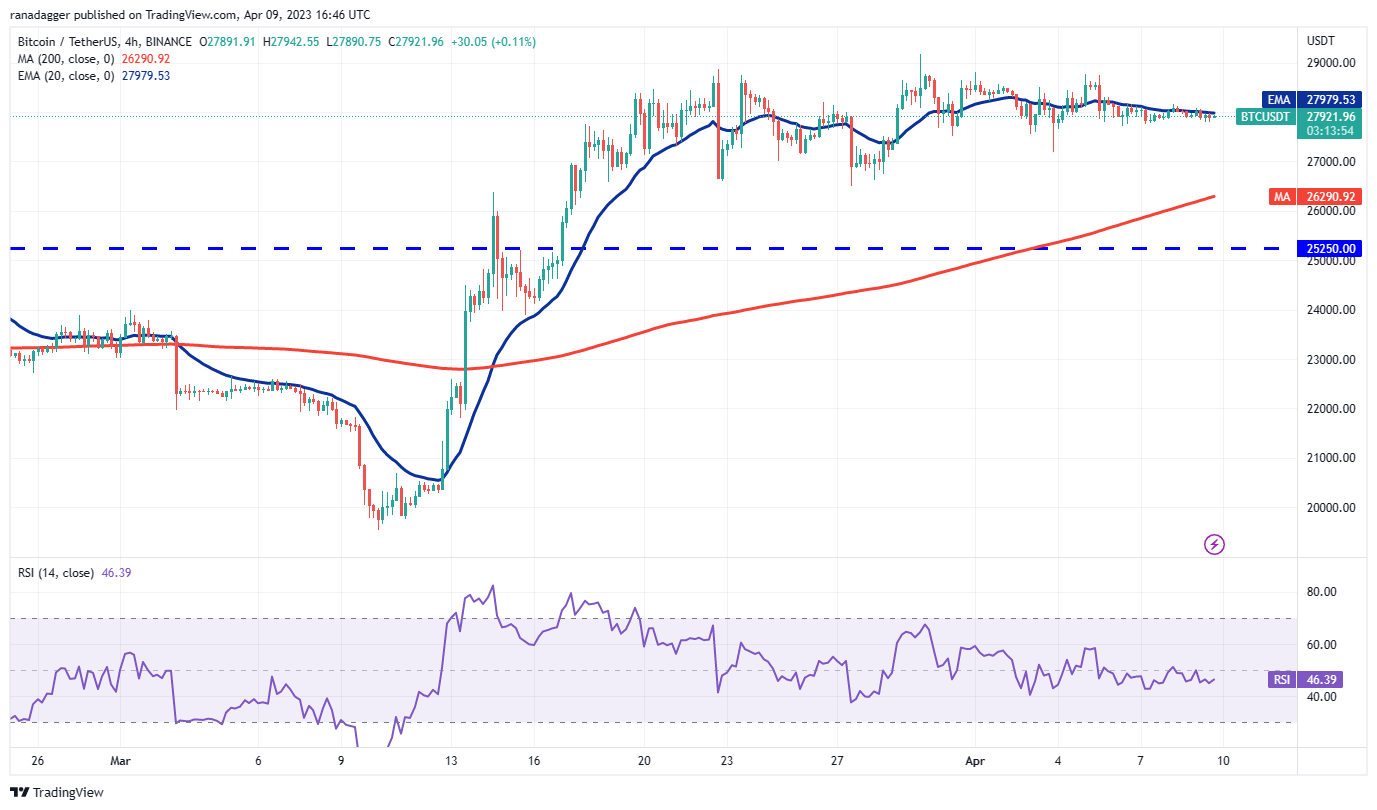
The 20 EMA is flattening out on the 4 hour chart and the RSI is just below the midpoint. This does not give a clear advantage to either the bulls or the bears. This uncertainty is unlikely to continue for long and a directional move could begin soon. However, it is difficult to predict the direction of the breakout.
Therefore, it is better to wait for the breakout to occur before placing directional bets. The important level to watch on the upside is $29,200 and on the downside is $26,500. A break of either level could initiate a short-term trending move.
Cardano Price Analysis
The bulls are not allowing Cardano (ADA) to dip below the 20-day EMA ($0.37), which indicates that demand is at lower levels.
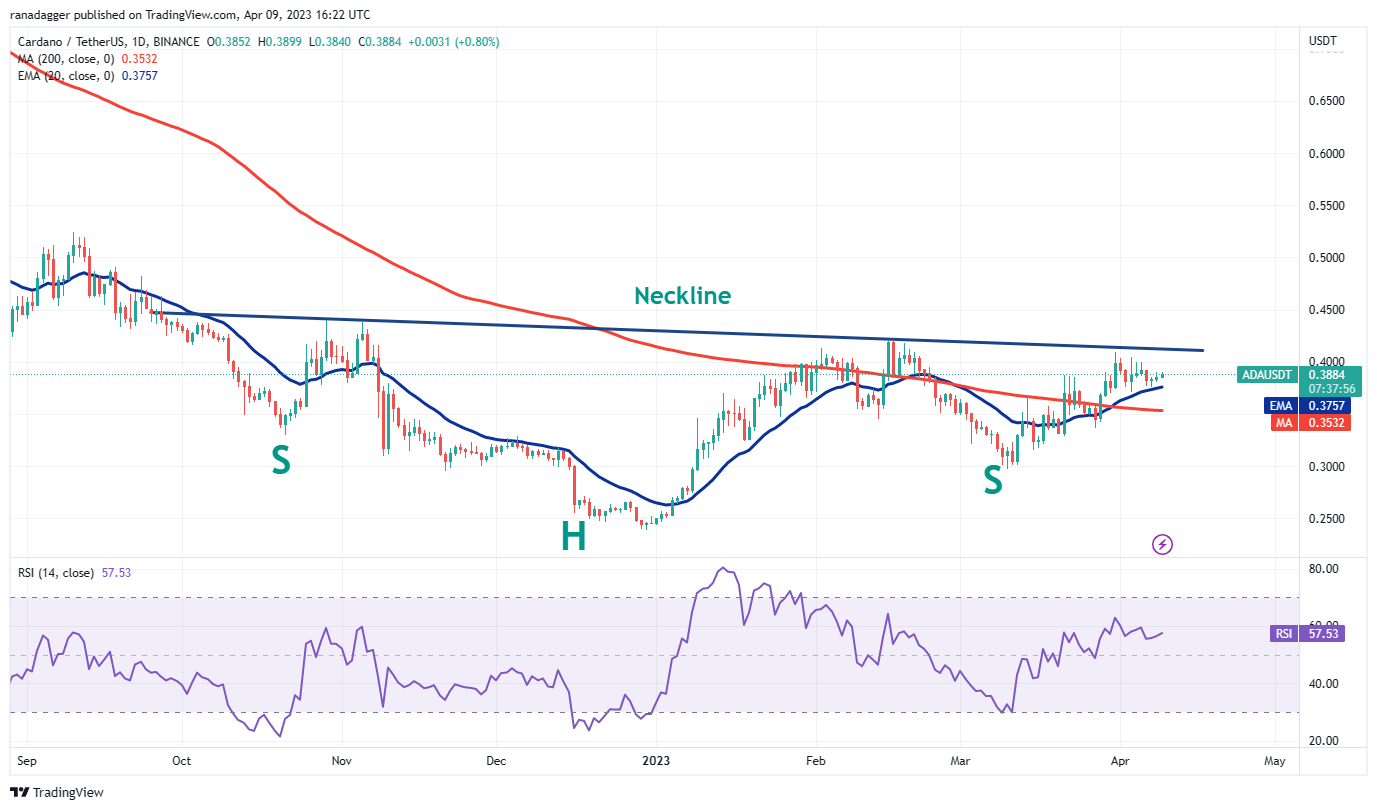
The rising 20-day EMA and the RSI in the positive area suggest that the path of least resistance is to the upside. The ADA/USDT pair could first rally to the neckline of the inverse head and shoulders (H&S) pattern. A break and close above this resistance will indicate a possible change in trend. The pair could then rally towards the pattern target of $0.60.
If the bears want to avoid the move to the upside, they will have to quickly drop the price below the 20 day EMA. The pair can then drop to the 200-day simple moving average ($0.35) and then to $0.30.
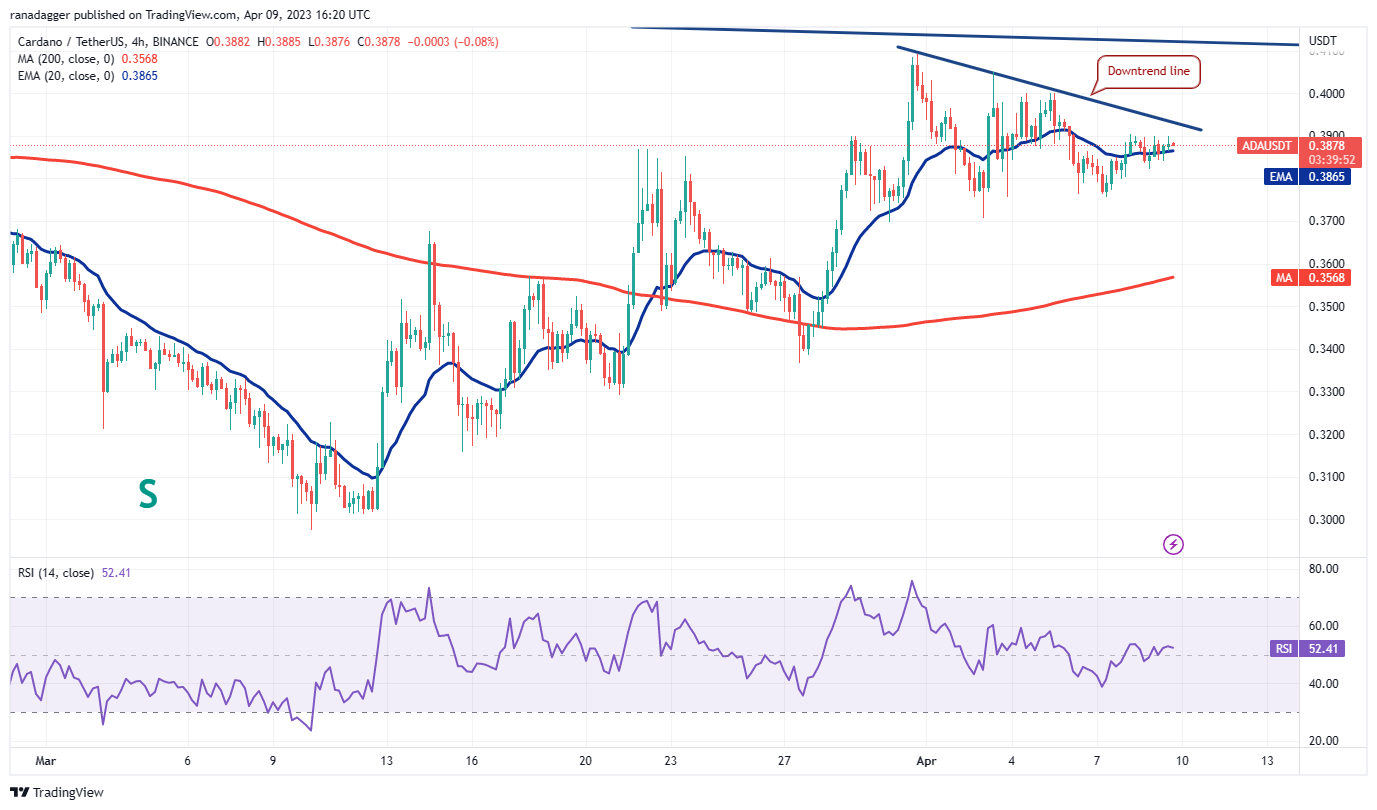
The 4-hour chart shows that the bulls have pushed the price above the 20-day EMA and will then try to break above the barrier at the downtrend line. If they do, it will suggest that the pullback may be over. The pair can then scale up to the neckline where the bears are expected to mount a strong defense.
Conversely, if the price faces a rejection at the downtrend line, it will suggest that the bears are active at higher levels. The selling could accelerate below $0.37 and the pair could drop to the 200 SMA.
Stellar Price Analysis
Stellar (XLM) has turned down from the overhead resistance of $0.12 and the price is approaching the 20-day EMA ($0.10). The bulls are likely to buy the dips to the 20 day EMA.
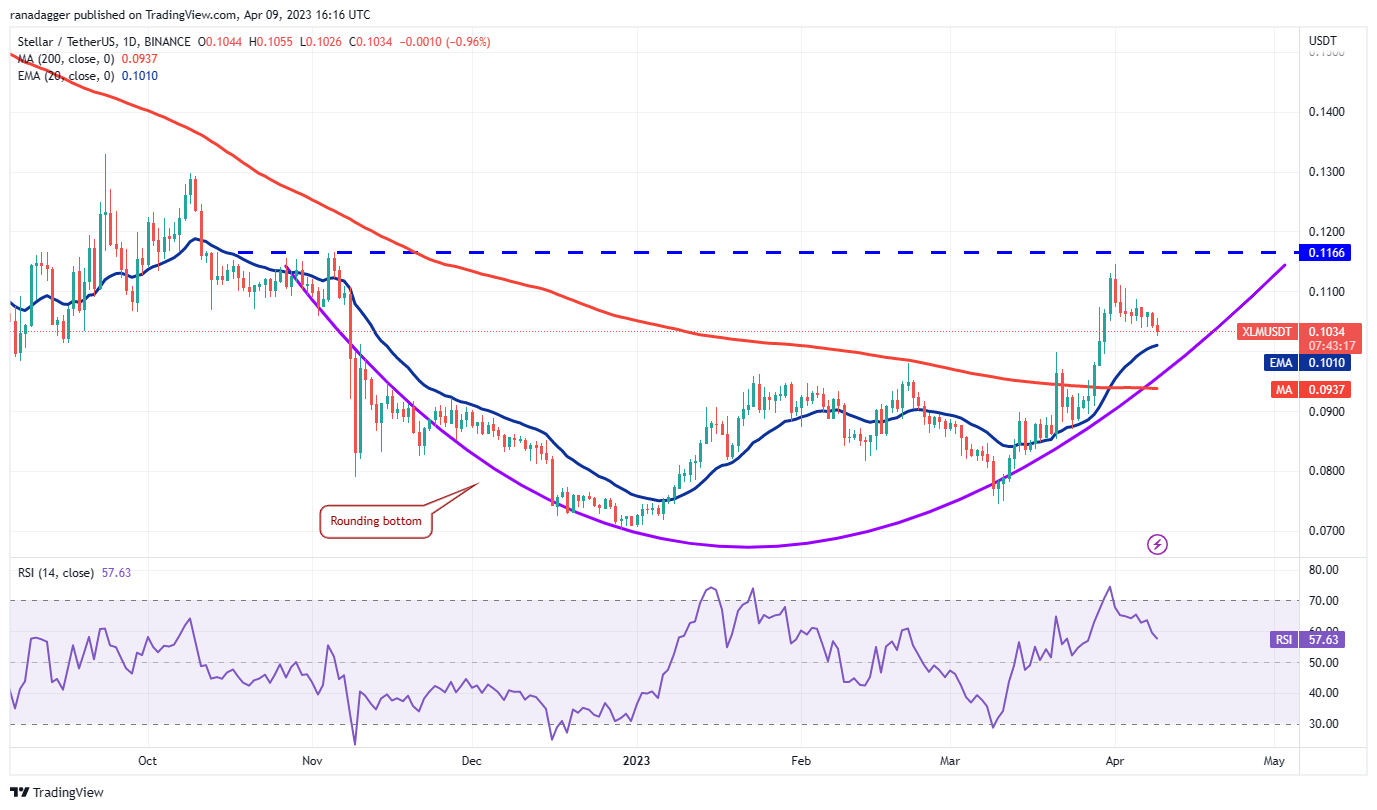
If the price bounces off the 20 day EMA, the bulls will once again try to clear the overall hurdle. If successful, the XLM/USDT pair will complete a rounding bottom pattern. That could signal the start of a new upward move. The pair can first rally to $0.15 and then move towards the pattern target of $0.17.
Contrary to this assumption, if the price turns down and breaks below the 20-day EMA, it will suggest that the bulls are losing control. The pair can then drop to the 200-day SMA ($0.09). This is a decisive level for the bulls because if it is broken, the pair can plummet to $0.07.
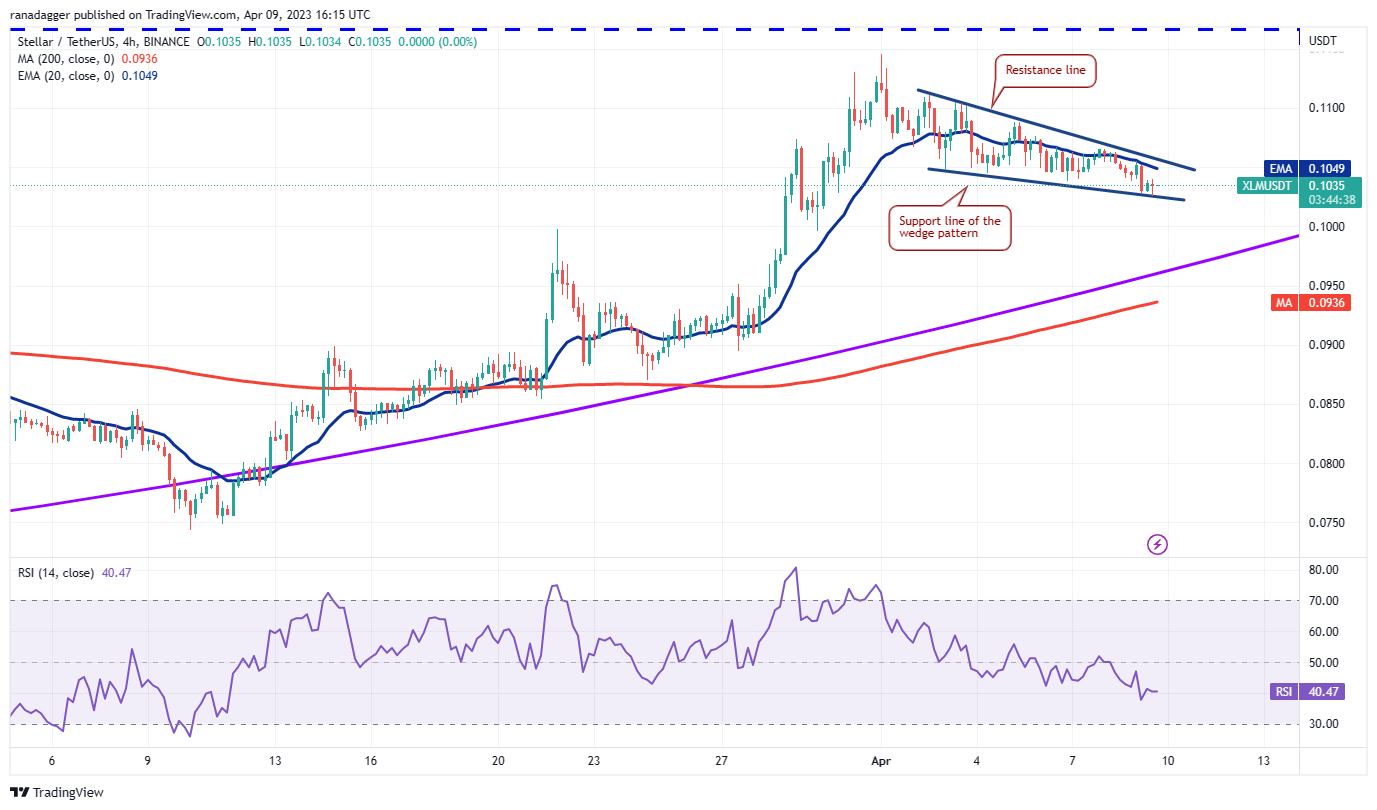
The 4 hour chart shows that the pair is correcting within a falling wedge pattern. The price has bounced off the support line and the bulls will try to push the pair above the wedge. If they can do that, the pair could rally to $0.11 and then $0.12.
On the other hand, if the price turns down and falls below the support line, it will suggest that selling has intensified. There is a bit of support at $0.10, but if that breaks, the fall could extend to the 200-SMA.
Related: SushiSwap approval bug leads to $3.3 million exploit
Aave Price Analysis
Aave (AAVE) has turned down from the overhead resistance of $82, indicating that the bears are fiercely protecting this level. They have pushed the price below the immediate support at the 20-day EMA ($75).
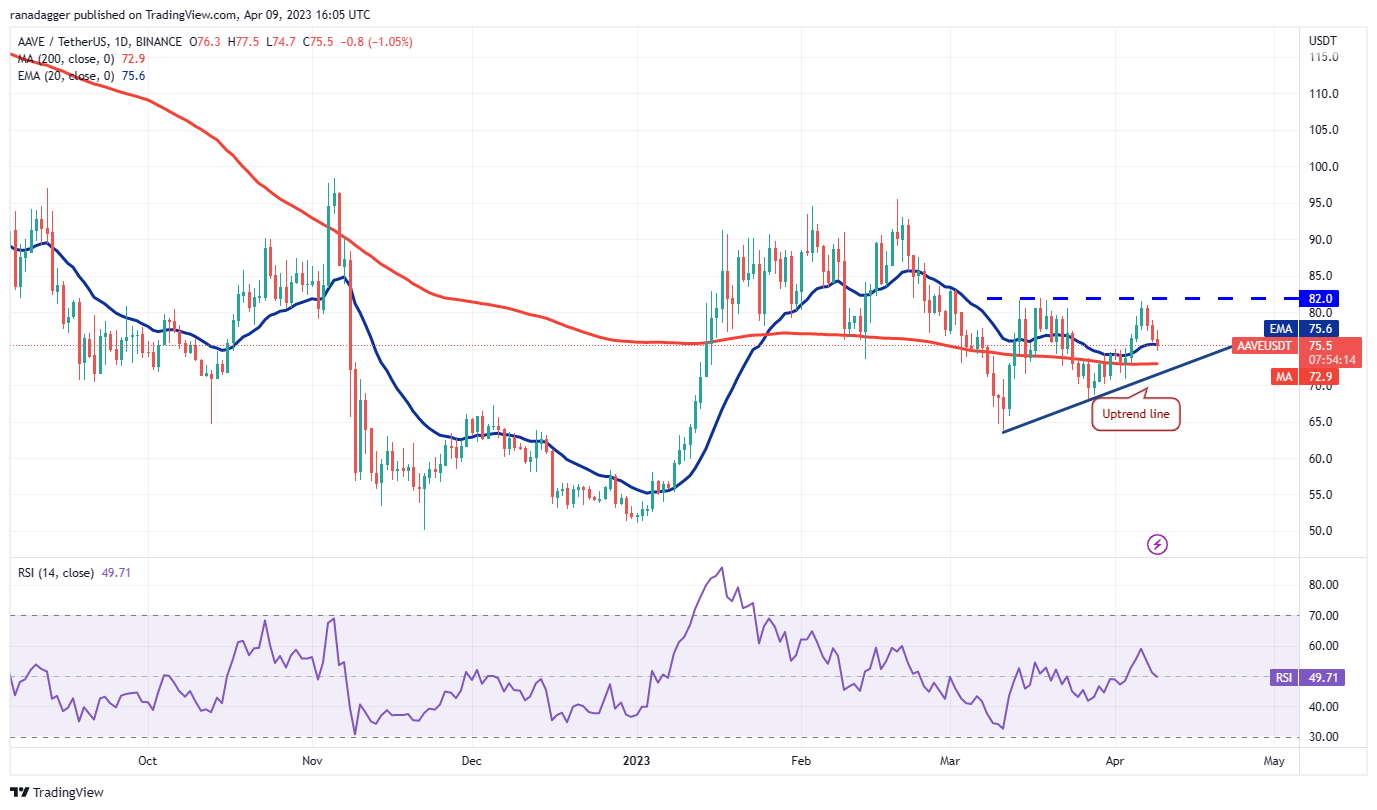
The AAVE/USDT pair could slide to the 200-day SMA ($73) next, which is close to the uptrend line. The buyers are likely to defend this level vigorously. If the price bounces off the uptrend line and breaks above the 20-day EMA, the pair could reach as high as $82.
If the bulls break out of this barrier, the pair will complete an ascending triangle pattern. This setup has a target of $100. This bullish view will be invalidated if the price continues lower and breaks below the uptrend line. Then the pair can slide to $68 and then to $64.
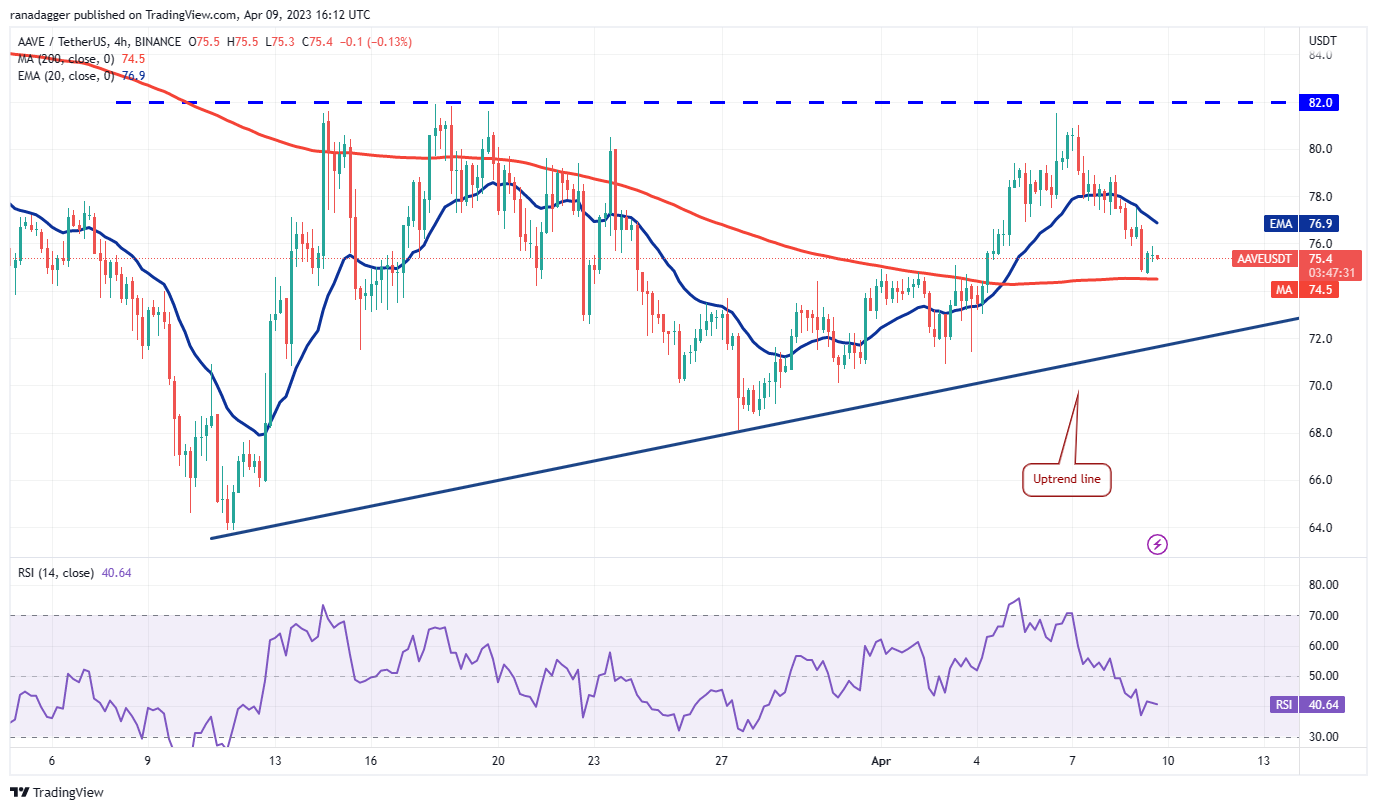
The bears have pushed the price to the 200-SMA on the 4-hour chart. The 20-EMA has started to turn lower and the RSI is in the negative territory, indicating that the bears have the upper hand.
If the 200-SMA gives way, the pair could drop further towards the uptrend line. This is an important level for the bulls to defend because a break below will further strengthen the bears.
To the upside, a break above the 20 EMA will be the first sign that the bulls are making a comeback. The pair can then rally to the overhead resistance at $82.
CFX Price Analysis
Conflux (CFX) has been in a corrective phase for the past few days, but one minor positive is that the bulls are trying to defend the 20-day EMA ($0.36).
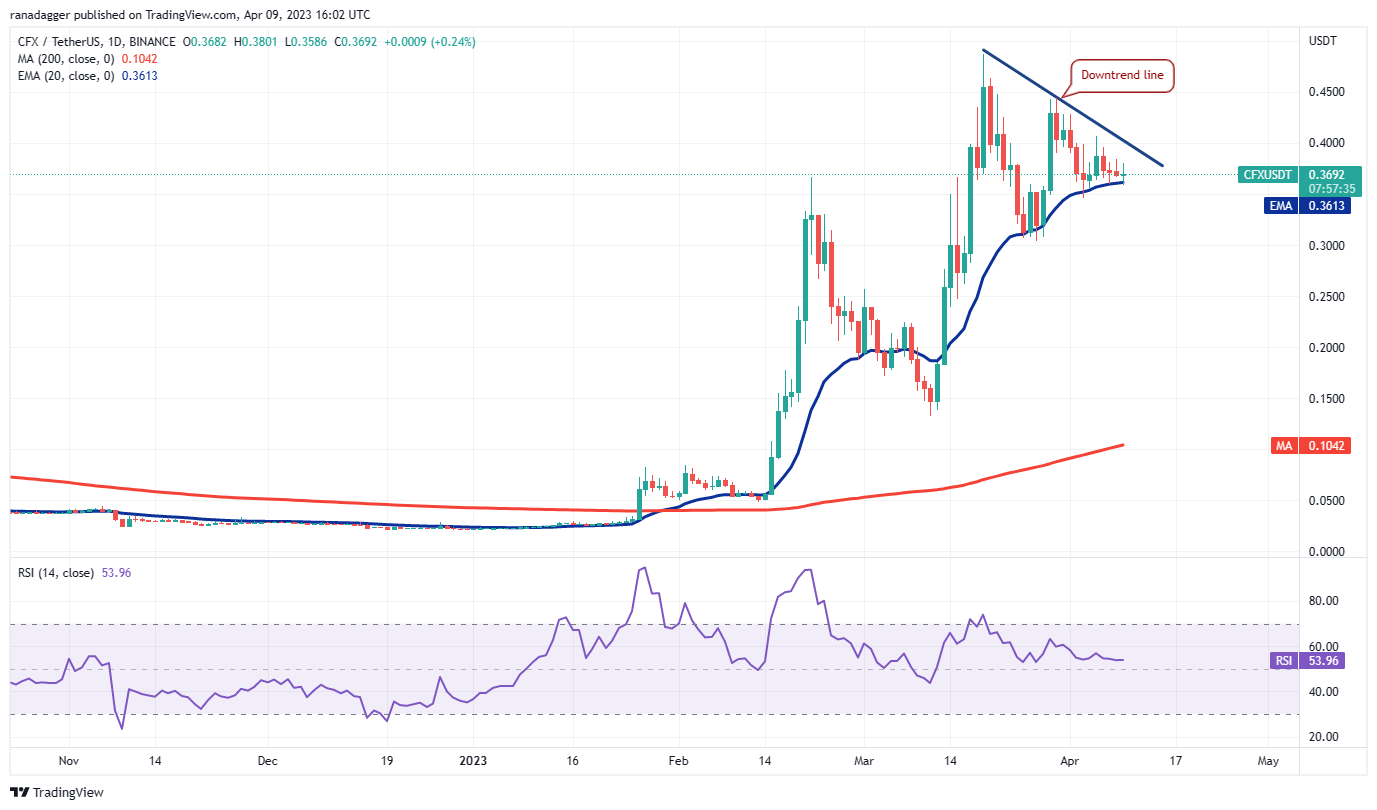
If the price bounces off the current level, the CFX/USDT pair could reach the downtrend line. This is an important level for bears to protect because a break above it could open the doors for a potential rally to $0.44, and then $0.49.
Conversely, if the price turns down and sustains below the 20 day EMA, it will suggest that the bulls may be racing to the exit. That could attract more selling, pushing the price towards the next support at $0.30. The bulls are expected to buy the dips at this level.
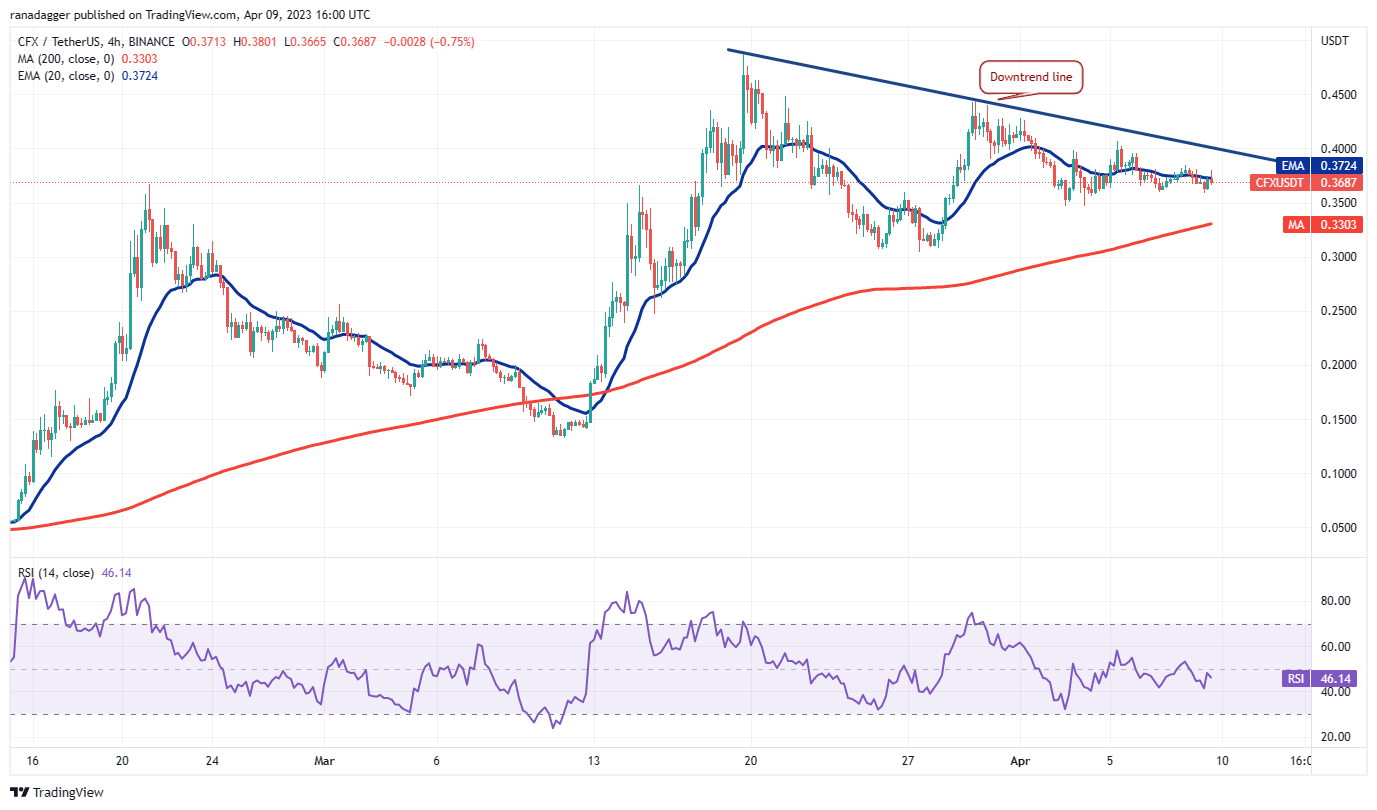
The 4-hour chart shows that the bears are trying to hold the price below the 20-day EMA. That could take the pair to the 200-SMA, which is likely to act as major support.
If the price bounces off this level, the bulls will try again to push the price to the downtrend line. This is the key level to watch because a break above it will indicate that the bulls are back in the game.
On the downside, a break and close below the $0.30 support could attract more selling, sinking the price to $0.25.
The views, thoughts and opinions expressed here are those of the authors alone and do not necessarily reflect or represent the views and opinions of Cointelegraph.
This article does not contain investment advice or recommendations. Every investment and trading move involves risk, and readers should do their own research when making a decision.


