
Bitcoin (BTC) price breached February 2023 highs of $25,200 after US inflation data matched market expectations. Potential fallout from the global banking system further promoted investment in Bitcoin as an uncorrelated global hedging instrument similar to gold in March. The correlation between gold and BTC has been on the rise since the beginning of the month.
However, institutions have become net sellers of Bitcoin in 2023, raising some red flags. Bitcoin whales, who hold between 10 and 10,000 BTC, have not participated in the current rally. It seems that retail investors are mainly driving the uptrend. The divergence between whale and retail investing could cause a short-term pullback in Bitcoin prices.
Institutions Are Forced Sellers of BTC, Says Analyst
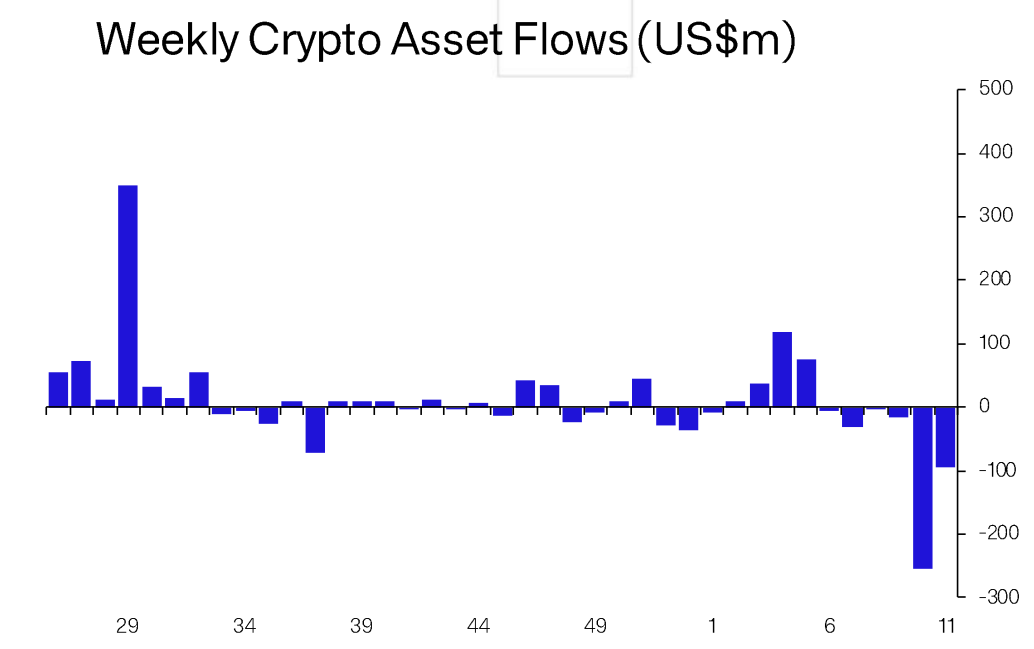
Institutional crypto asset flows data from CoinShares reported the biggest mutual fund sell-off in two weeks since March 6. The outflows have wiped out this year’s positive inflows, with a net flow to date of negative $177 million.
CoinShares data tracks the portfolio of global institutional funds with exposure to digital assets, including Grayscale, Coinshares XBT, 21Shares, Purpose, and 3iQ.
James Butterfill, head of research at CoinShares, noted in the report that the flows “may be driven, in part, by the need for liquidity during this banking crisis; A similar situation was observed when the COVID panic first hit the market in March 2020.”
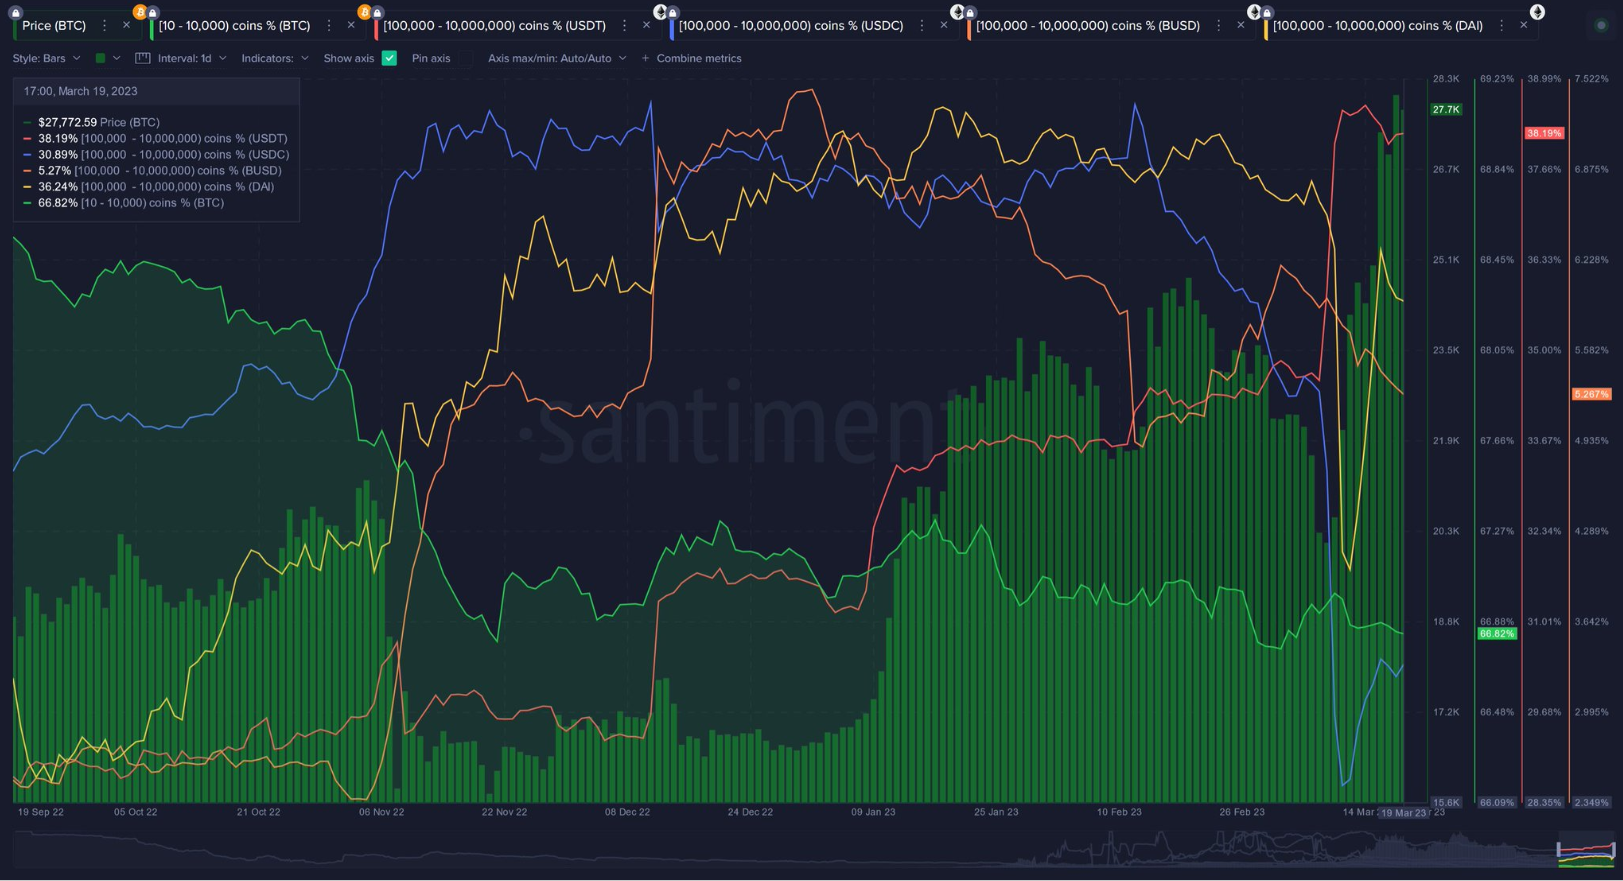
Butterfill’s theory about forced sales by institutions may have some credibility, as on-chain analytics firm Santiment reported to Cointelegraph that they “are not currently seeing large whale sales at this time.” Bitcoin addresses holding between 10 and 10,000 BTC have been essentially flat.”
It is encouraging that the whales are not looking to sell the current rally. However, as prices continue to rise, the asset will require whale buyers to join the bandwagon; otherwise, the rally could fade soon.
Also, the recent incident with the USDC de-pegging and the regulatory crackdown on the BUSD stablecoin has likely caused a minor exodus of stablecoin whales. Santiment reported that “addresses holding between $100,000 and $10 million in stablecoins have declined slightly, but not to a noticeably high degree.”
A flow from stablecoins to Bitcoin and other cryptocurrencies is positive for prices. However, large-scale conversions from stablecoins to USD weaken the purchasing power of the market. The lack of addition in whale BTC holdings suggests that the flows represent more of the latter situation.
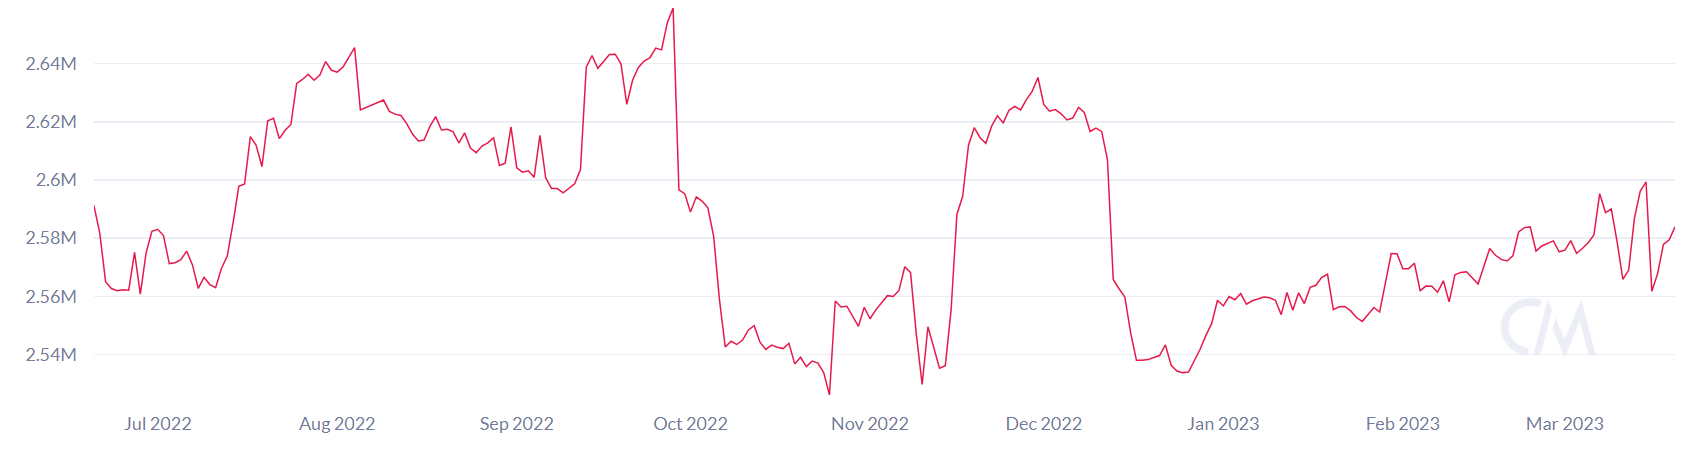
Another crucial player in the Bitcoin economy is BTC miners. BTC holdings in one-hop miner addresses, which represent BTC accounts receiving coins from mining pools, have risen steadily since early 2023.
Some miners made a few profits on March 14 when the Bitcoin price topped $25,000 for the first time and again a week later when it hit $28,000. However, total holdings are still trending up from early 2023.
Retail investors in spot exchanges are driving prices up
So far, spot buying by retail investors is likely driving the rally. Independent network analyst and co-founder of Reflexivity Research, Will Clemente, tweeted that the uptrend “appears to be mostly spot driven” with muted open interest volumes for BTC futures contracts and funding rates on perpetual contracts.
Holdings of BTC addresses with less than 10 BTC continue to rise to new all-time highs. The distribution among small hands adds credibility to the “arguments against Bitcoin regarding the concentration of supply” among some large holders.
Related: Holding Bitcoin: A Profitable Proposition 88.5% of the Days
However, retail investors have a poor track record in timing market entries and exits. Therefore, investor participation in whales is crucial for confidence in the current rally.
Technically, the BTC/USD pair looks strong on a daily time frame with a positive breakout and consolidation above its widening wedge pattern. Buyers are currently facing resistance from the June 2022 breakout levels between $28,000 and $30,000.
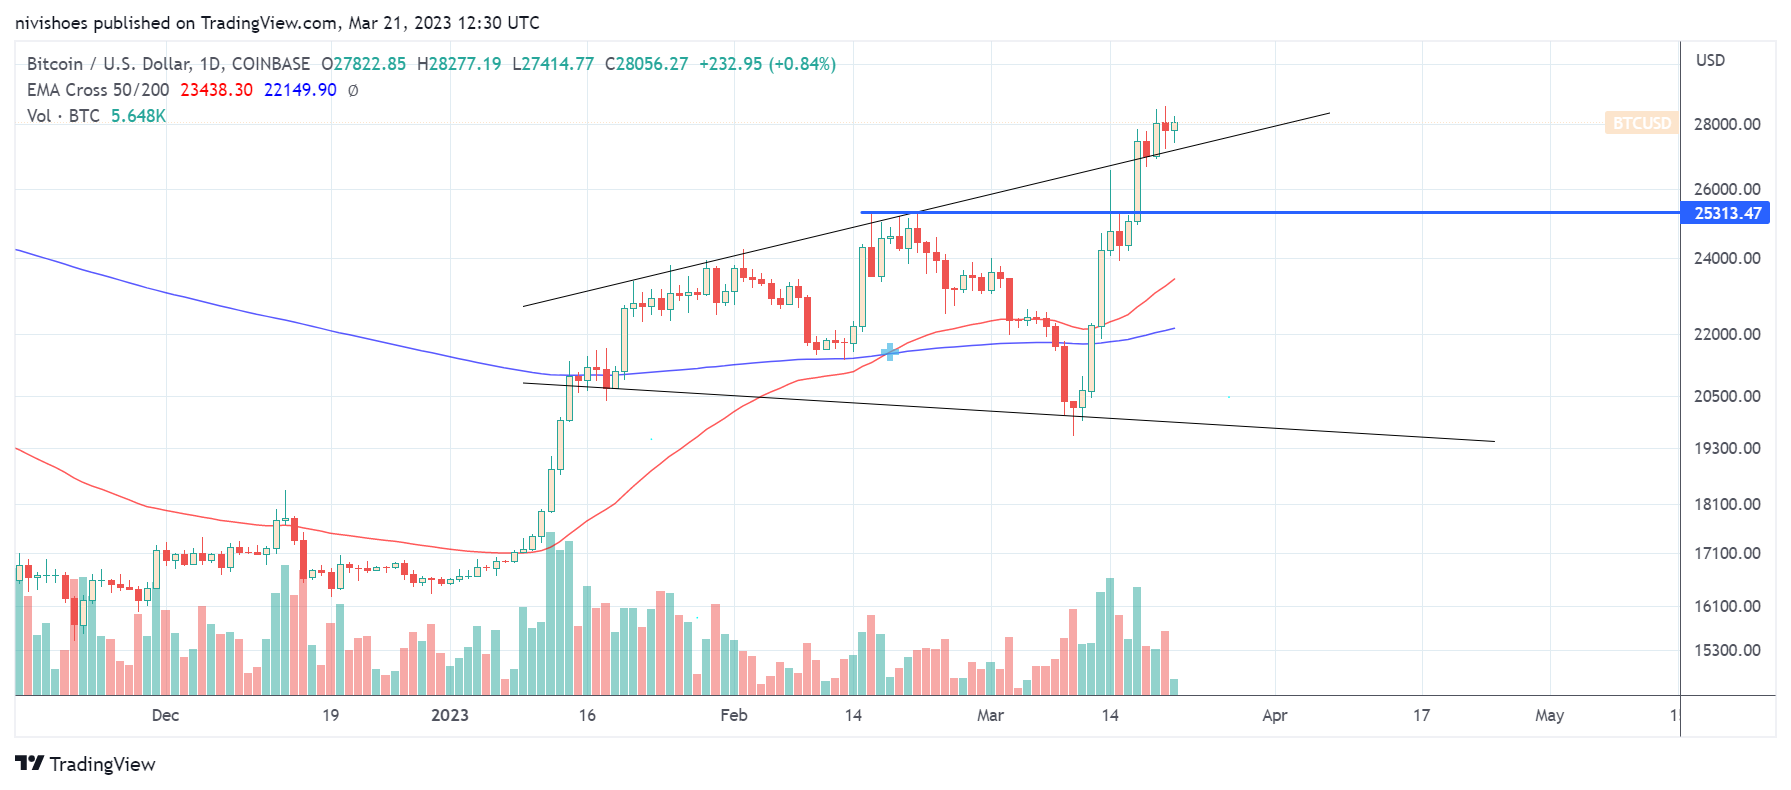
On the other hand, CME futures data raises the possibility of a pullback with two unfilled gaps towards $26,500 and $19,500. A price gap forms on CME futures charts during US holidays and weekends, when spot trading of Bitcoin on exchanges creates a difference between the closing and opening price on CME.
Typically, CME gaps are filled with a price action towards the CME closing price to retrace the pump in the futures market. Veteran Trader Peter Brandt advised opening a short BTC position based on the gap.
There is a chance that more sophisticated investors are waiting for the US Federal Reserve’s policy rate meeting on March 22 before opening their swing positions. The Fed’s policy rate announcement will likely act as a strong market mover, inducing significant volatility in the market.
The views, thoughts and opinions expressed here are those of the authors alone and do not necessarily reflect or represent the views and opinions of Cointelegraph.
This article does not contain investment advice or recommendations. Every investment and trading move involves risk, and readers should do their own research when making a decision.


