Bitcoin price has dipped below the $30,000 level after on-chain data for the coin showed signs of overheating in the futures market.
Bitcoin funding rate was very positive yesterday
Bitcoin had held up quite well around the $30,000 level for the past week, but the cryptocurrency has seen a decline below the mark today.
Signs that a crash was coming were apparently visible yesterday, as an analyst at CryptoQuant. mail had pointed out. To be more specific, two futures market indicators, open interest and funding rates, had values that may have hinted at the asset falling in advance.
“Open Interest” is an indicator that measures the total number of Bitcoin futures contracts that are currently open on derivatives exchanges. This metric takes into account both long and short positions.
When the value of this metric increases, it means that investors are opening new contracts in the market right now. Since leverage generally increases in the sector with opening more positions, this type of trend can make the price of the cryptocurrency more volatile.
On the other hand, the indicator showing a decline suggests that holders are closing their positions or being liquidated by their platforms. Naturally, such a trend can lead to the price becoming more stable.
Now, here’s a chart showing the trend in Bitcoin’s 30-day moving average (MA) open interest over the past month:
Looks like the value of the metric has declined somewhat recently | Source: CryptoQuant
As shown in the chart above, Bitcoin’s open interest rose to quite high values when the price of the asset jumped above the $30,000 level a week ago. But a few days ago, the metric registered a bit of a decline as the price broke above $31,000 and then fell back below it.
However, it is clear from the chart that while these new levels that the indicator fell to were notably lower than the highs previously seen, they were still much higher than the values seen just before the big spike hit.
These still significant levels persisted through yesterday, meaning that the Bitcoin futures market potentially still had a large amount of leverage. Based on this, it is not surprising that the coin has seen some volatility today.
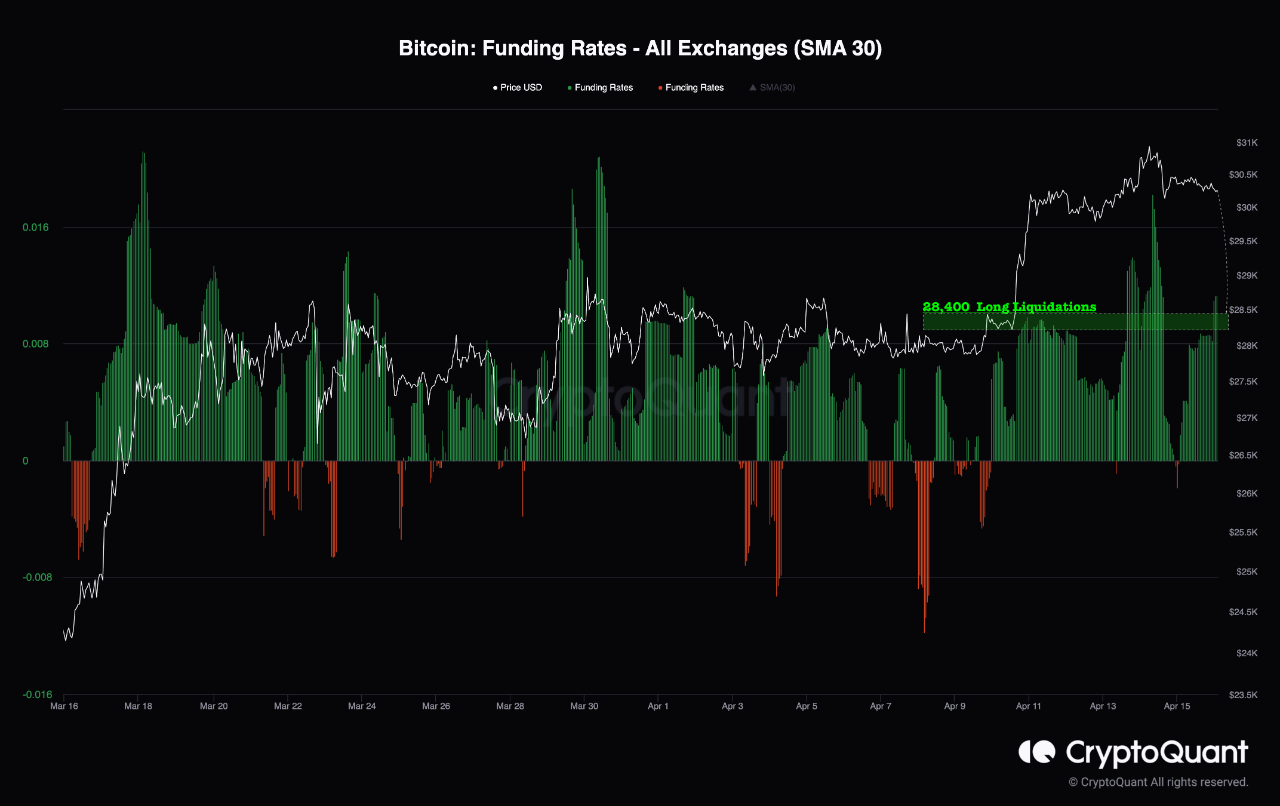
The other relevant indicator here is the “funding rate”, which tells us about the periodic fee that traders in the futures market are exchanging with each other.
When this metric is positive, it means that the longs are paying shorts at the moment, and therefore bullish sentiment is more dominant in the market today. Similarly, negative values imply that the majority share a bearish mindset. The chart below shows what the metric looked like yesterday.

The indicator seems to have had positive values in recent days | Source: CryptoQuant
As can be seen on the chart, the Bitcoin funding rate was very positive yesterday, suggesting that long positions outnumbered short ones. Historically, when such green metric values have accompanied high open interest, a long contraction in the market has become more likely.
A “squeeze” is a massive liquidation event in which liquidations cascade down like a waterfall. According to data from glass coinin the last day there have been important settlements, and since financing rates were already coming forward, most of the settled contracts have been long-term.
Bitcoin price
At the time of writing, Bitcoin is trading around $29,900, up 5% in the past week.
BTC has plunged during the past day | Source: BTCUSD on TradingView
Featured Image by Maxim Hopman on Unsplash.com, Charts from TradingView.com, CryptoQuant.com
 NEWSLETTER


