
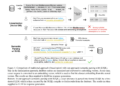
Analysis of Landsat-8 imagery (2014-2023) to create the Great Salt Lake surface time series using Python in Google Colab
- Introduction to the Great Salt Lake Shrinking Problem
- Landsat-8 image download
- Statistical Archive Great Salt Lake Area Time Series
- Landsat-8 image processing
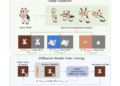
- Viewing Images of the Great Salt Lake
- Timelapse of the contraction of the Great Salt Lake
- Time series of the Great Salt Lake area from classified images
- Comparison of time series from statistics and images file
- Conclusion
- References
Introduction to the Great Salt Lake Shrinking Problem
The Great Salt Lake in Utah, USA, is experiencing long-term contraction. According to various reports, the lake has shrunk by more than 30% compared to its maximum size in 1986. Various reasons have been cited for the declining water level in this lake, including climate change and water splitting to the Agriculture.
Regarding the climate change factor, precipitation patterns have reportedly altered and temperatures have increased, contributing to a decrease in snow cover and a reduction in inflows to the lake.
As for the second reason, in recent years both urban and agricultural areas have expanded. Rising demand in both the urban and agricultural sectors has further contributed to declining water levels.
The long-term decline has consequences for the ecosystem, particularly on air and water quality. Exposure of lakebed areas increases risks to air and water quality by releasing dust and salts.
As the situation is dynamic and there are ongoing discussions about monitoring declining water levels, I decided to write this post to demonstrate how we can use satellite imagery to monitor changes in the lake surface…


