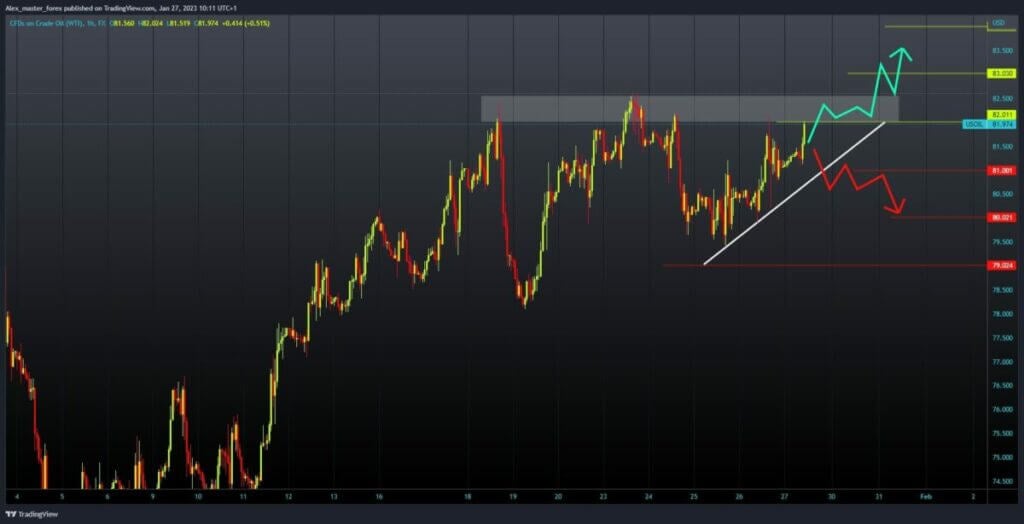
- During the Asian trading session, the price of oil increased from $81.00 to $81.50.
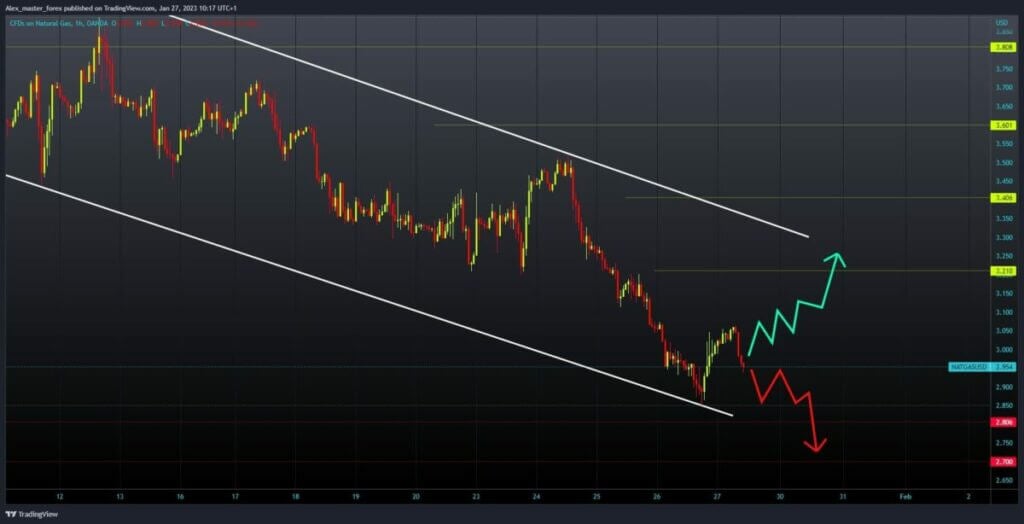
- During the Asian trading session, the price of oil rose to $3.06.
Oil chart analysis
During the Asian trading session, the price of oil increased from $81.00 to $81.50. In the European session, the price continues to grow, and we are now at the $81.75 level. If this trend continues, we could reach towards the $82.00 level soon. So we need a break above, and a test of this week’s high at the $82.50 level. If we can break through and get past it, we have an excellent opportunity to start a new recovery.
A higher potential target is the $83.00 level. We need negative consolidation and a price pullback to the $81.00 level for a bearish option. Then, the oil price could start a further decline to the next support at the $80.00 level. The low price of oil this week was at the $79.40 level.

Natural Gas Chart Analysis
During the Asian trading session, the price of oil rose to $3.06. Price finds resistance at that level, makes another turn lower, and returns below the $3.00 level. The current price of gasoline is $2.95, and there is a good chance that we will retest the previous low of $2.85. A break below would signify the continuation of the bearish option and the formation of a new lower low.
The lower potential targets are the $2.80 and $2.70 levels. For a bullish option, we need further positive consolidation and a yield above the $3.00 level. After that, we could think about a possible further recovery.

BONUS VIDEO: Weekly summary of market news
(embed)https://www.youtube.com/watch?v=Dqw6Gg4r8kI(/embed)


