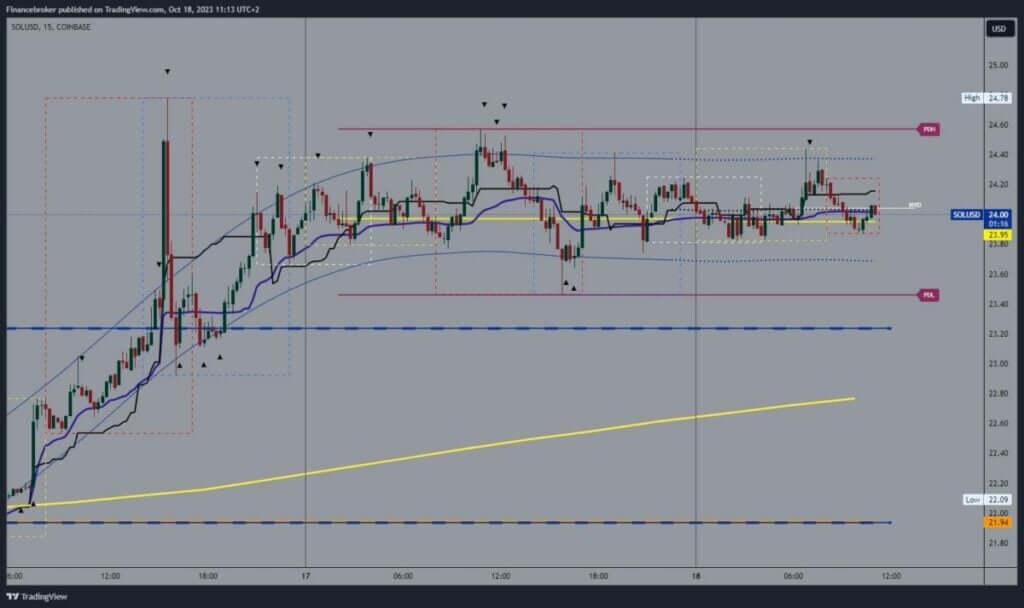
- Solana price continued the previous bullish consolidation, moving in the 23.80-24.40 range.
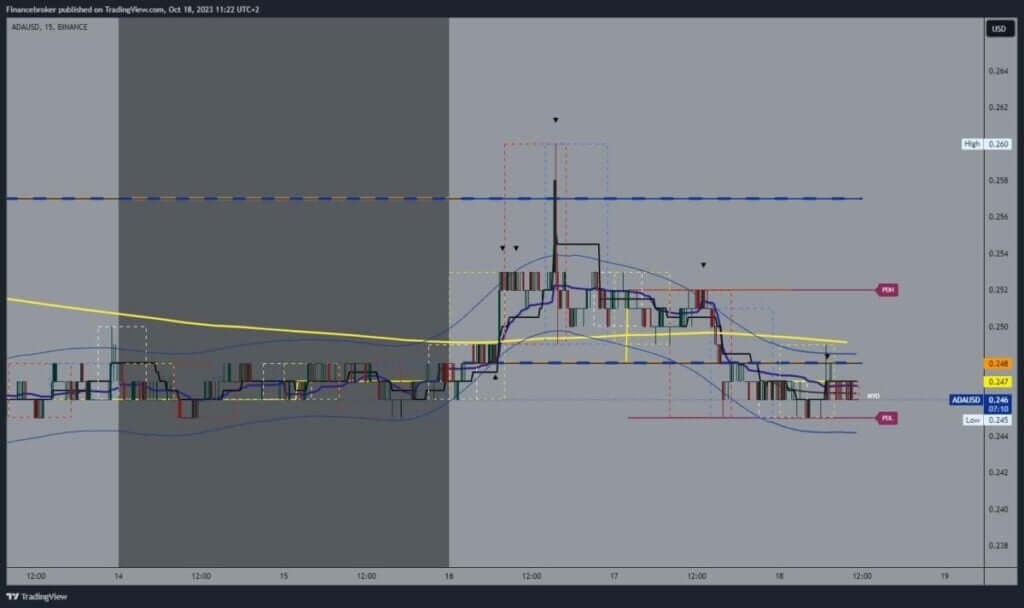
- Cardano price yesterday fell below the 0.250 level and below the EMA50 moving average.
Solana Chart Analysis
Solana price continued the previous bullish consolidation, moving in the 23.80-24.40 range. We still remain high and near the previous resistance at the 24.60 level. This week’s high was 24.80; If we continue with the current consolidation, we could expect a test of that level. The next important level is at 25:00.
We need a negative consolidation and a price drop below the 23.80 level for a bearish option. A break below could influence us to test yesterday’s low at the 23.60 level. And if the pressure continues, a new advance and the formation of a new low could occur. The lowest possible targets are levels 23.40 and 23.20.

Cardano Chart Analysis
Cardano price yesterday fell below the 0.250 level and below the EMA50 moving average. This led to the formation of this week’s low at the level of 0.245; For now, we have managed to stay above it. Cardano remains under pressure below the EMA50, which could influence us to see a continuation of the pullback and the formation of a new five-day low. The lowest possible targets are the 0.244 and 0.242 levels.
We need a positive consolidation and a return above the 0.250 level and the EMA50 moving average for a bullish call. So we would have to stay up there to continue the recovery from that level. The highest potential targets are the 0.252 and 0.254 levels.

ADDITIONAL VIDEO: Weekly summary of market news
!function(f,b,e,v,n,t,s){if(f.fbq)return;n=f.fbq=function(){n.callMethod?n.callMethod.apply(n,arguments):n.queue.push(arguments)};if(!f._fbq)f._fbq=n;n.push=n;n.loaded=!0;n.version=’2.0′;n.queue=();t=b.createElement(e);t.async=!0;t.src=v;s=b.getElementsByTagName(e)(0);s.parentNode.insertBefore(t,s)}(window,document,’script’,’https://connect.facebook.net/en_US/fbevents.js’);fbq(‘init’,’504526293689977′);fbq(‘track’,’PageView’)


