- Since the beginning of this week, Solana price has followed a strong upward trend.
- Cardano price jumped to the 0.260 level at one point yesterday.
Solana Chart Analysis
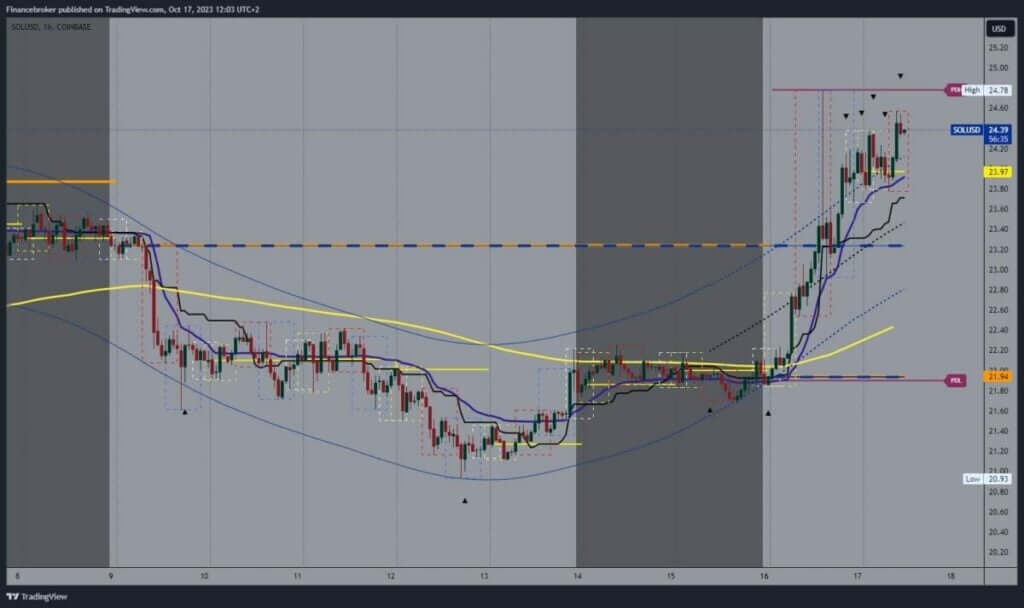
Since the beginning of this week, Solana price has followed a strong upward trend. Yesterday we saw a jump to the 24.78 level and the formation of a two-week high. After that, a pullback to 23.20, where we get new support and move towards another bullish consolidation above the 24.00 level. Today’s high is at 24.60 and it could happen that we break above and test the previous high.
The highest potential targets are the 24.80 and 25.00 levels. We need a negative consolidation and a pullback below the 23.80 level for a bearish option. After that, we would expect to see a further pullback to lower support levels. The lowest possible targets are levels 23.60 and 23.40.

Cardano Chart Analysis
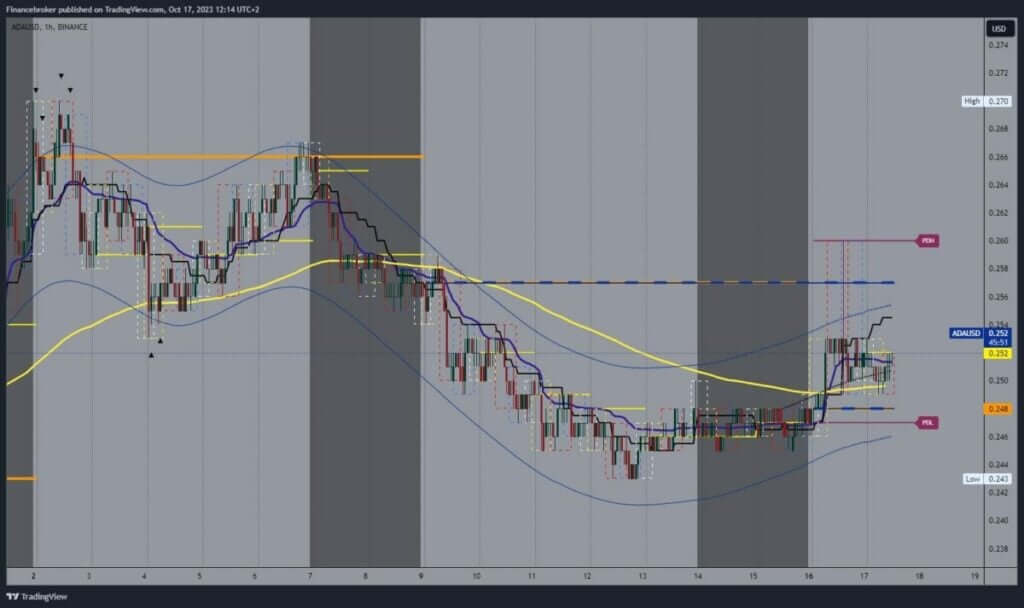
Cardano price jumped to the 0.260 level at one point yesterday. This was followed by a pullback to the 0.250 support level. Additional support in that area lies at the EMA50 moving average. For now, the price manages to stay above the support level and recover to the 0.252 level. We could expect to see a continued recovery and a continuation to the bullish side.
The highest potential targets are the 0.256 and 0.258 levels. We need a negative consolidation and a break below the EMA50 moving average for a bearish option. This would have the effect of increasing pressure on Cardano to initiate more withdrawals. The lowest possible targets are the 0.246 and 0.244 levels.

ADDITIONAL VIDEO: Weekly summary of market news
!function(f,b,e,v,n,t,s){if(f.fbq)return;n=f.fbq=function(){n.callMethod?n.callMethod.apply(n,arguments):n.queue.push(arguments)};if(!f._fbq)f._fbq=n;n.push=n;n.loaded=!0;n.version=’2.0′;n.queue=();t=b.createElement(e);t.async=!0;t.src=v;s=b.getElementsByTagName(e)(0);s.parentNode.insertBefore(t,s)}(window,document,’script’,’https://connect.facebook.net/en_US/fbevents.js’);fbq(‘init’,’504526293689977′);fbq(‘track’,’PageView’)


