- Yesterday, we saw Bitcoin’s attempt to reach the $26,000 level.
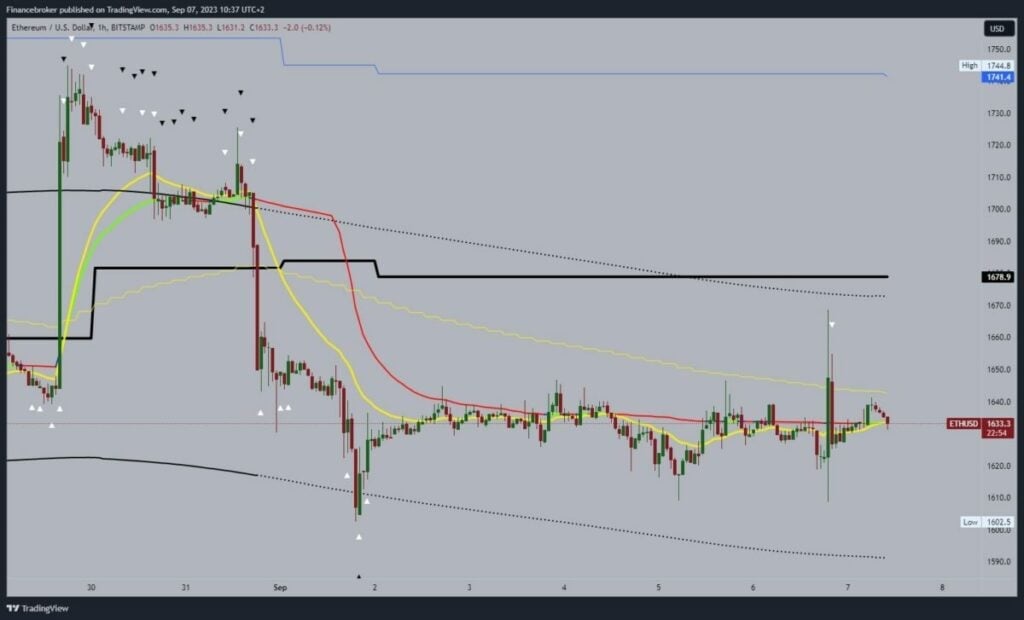
- Ethereum price jumped to $1668 level yesterday.
Bitcoin chart analysis
Yesterday, we saw Bitcoin’s attempt to reach the $26,000 level. He succeeded in doing so, but a pullback to the $25,600 level quickly followed. After that, we see a new attempt and recovery to the $25800 level, where we encounter new resistance and pullback. The current price is $25730, and we could expect the price to continue to slide down slowly. Potential lower targets are $25600 and $25500 levels.
We need a new positive consolidation and a price jump above the $25800 level for a bullish option. Then we need to hold above there in order to move further towards the $26000 level. Potential higher targets are $26100 and $26200 levels. We have additional pressure on the price in the zone around $26,000 in the EMA50 moving average.
Ethereum chart analysis
Ethereum price jumped to $1668 level yesterday. The joy was short-lived, and a quick return to the $1625 level followed. After that, we saw another bullish attempt, but it ended at the $1640 level. Now, we again see bearish consolidation and a return to the zone around the $1630 level. It is very possible that we will now continue the pullback to $1620, where we could look for the first support.
A break below this support level would increase the bearish pressure on the price to go further down. Potential lower targets are $1610 and $1620 levels. We need a positive consolidation and a return above the $1640 level for a bullish option. In that zone, we encounter the EMA50 moving average, and we need a break above to continue to the bullish side. Potential higher targets are $1650 and $1660 levels.

BONUS VIDEO: Weekly news summary from the markets
(embed)https://www.youtube.com/watch?v=ilWhYn7tdxY(/embed)


