The price of Ethereum’s native token Ether (ETH) has rallied 78% since June 2022. But this does not guarantee a further rally, particularly with declining trading volumes, suggesting that the risk of a major correction is high.
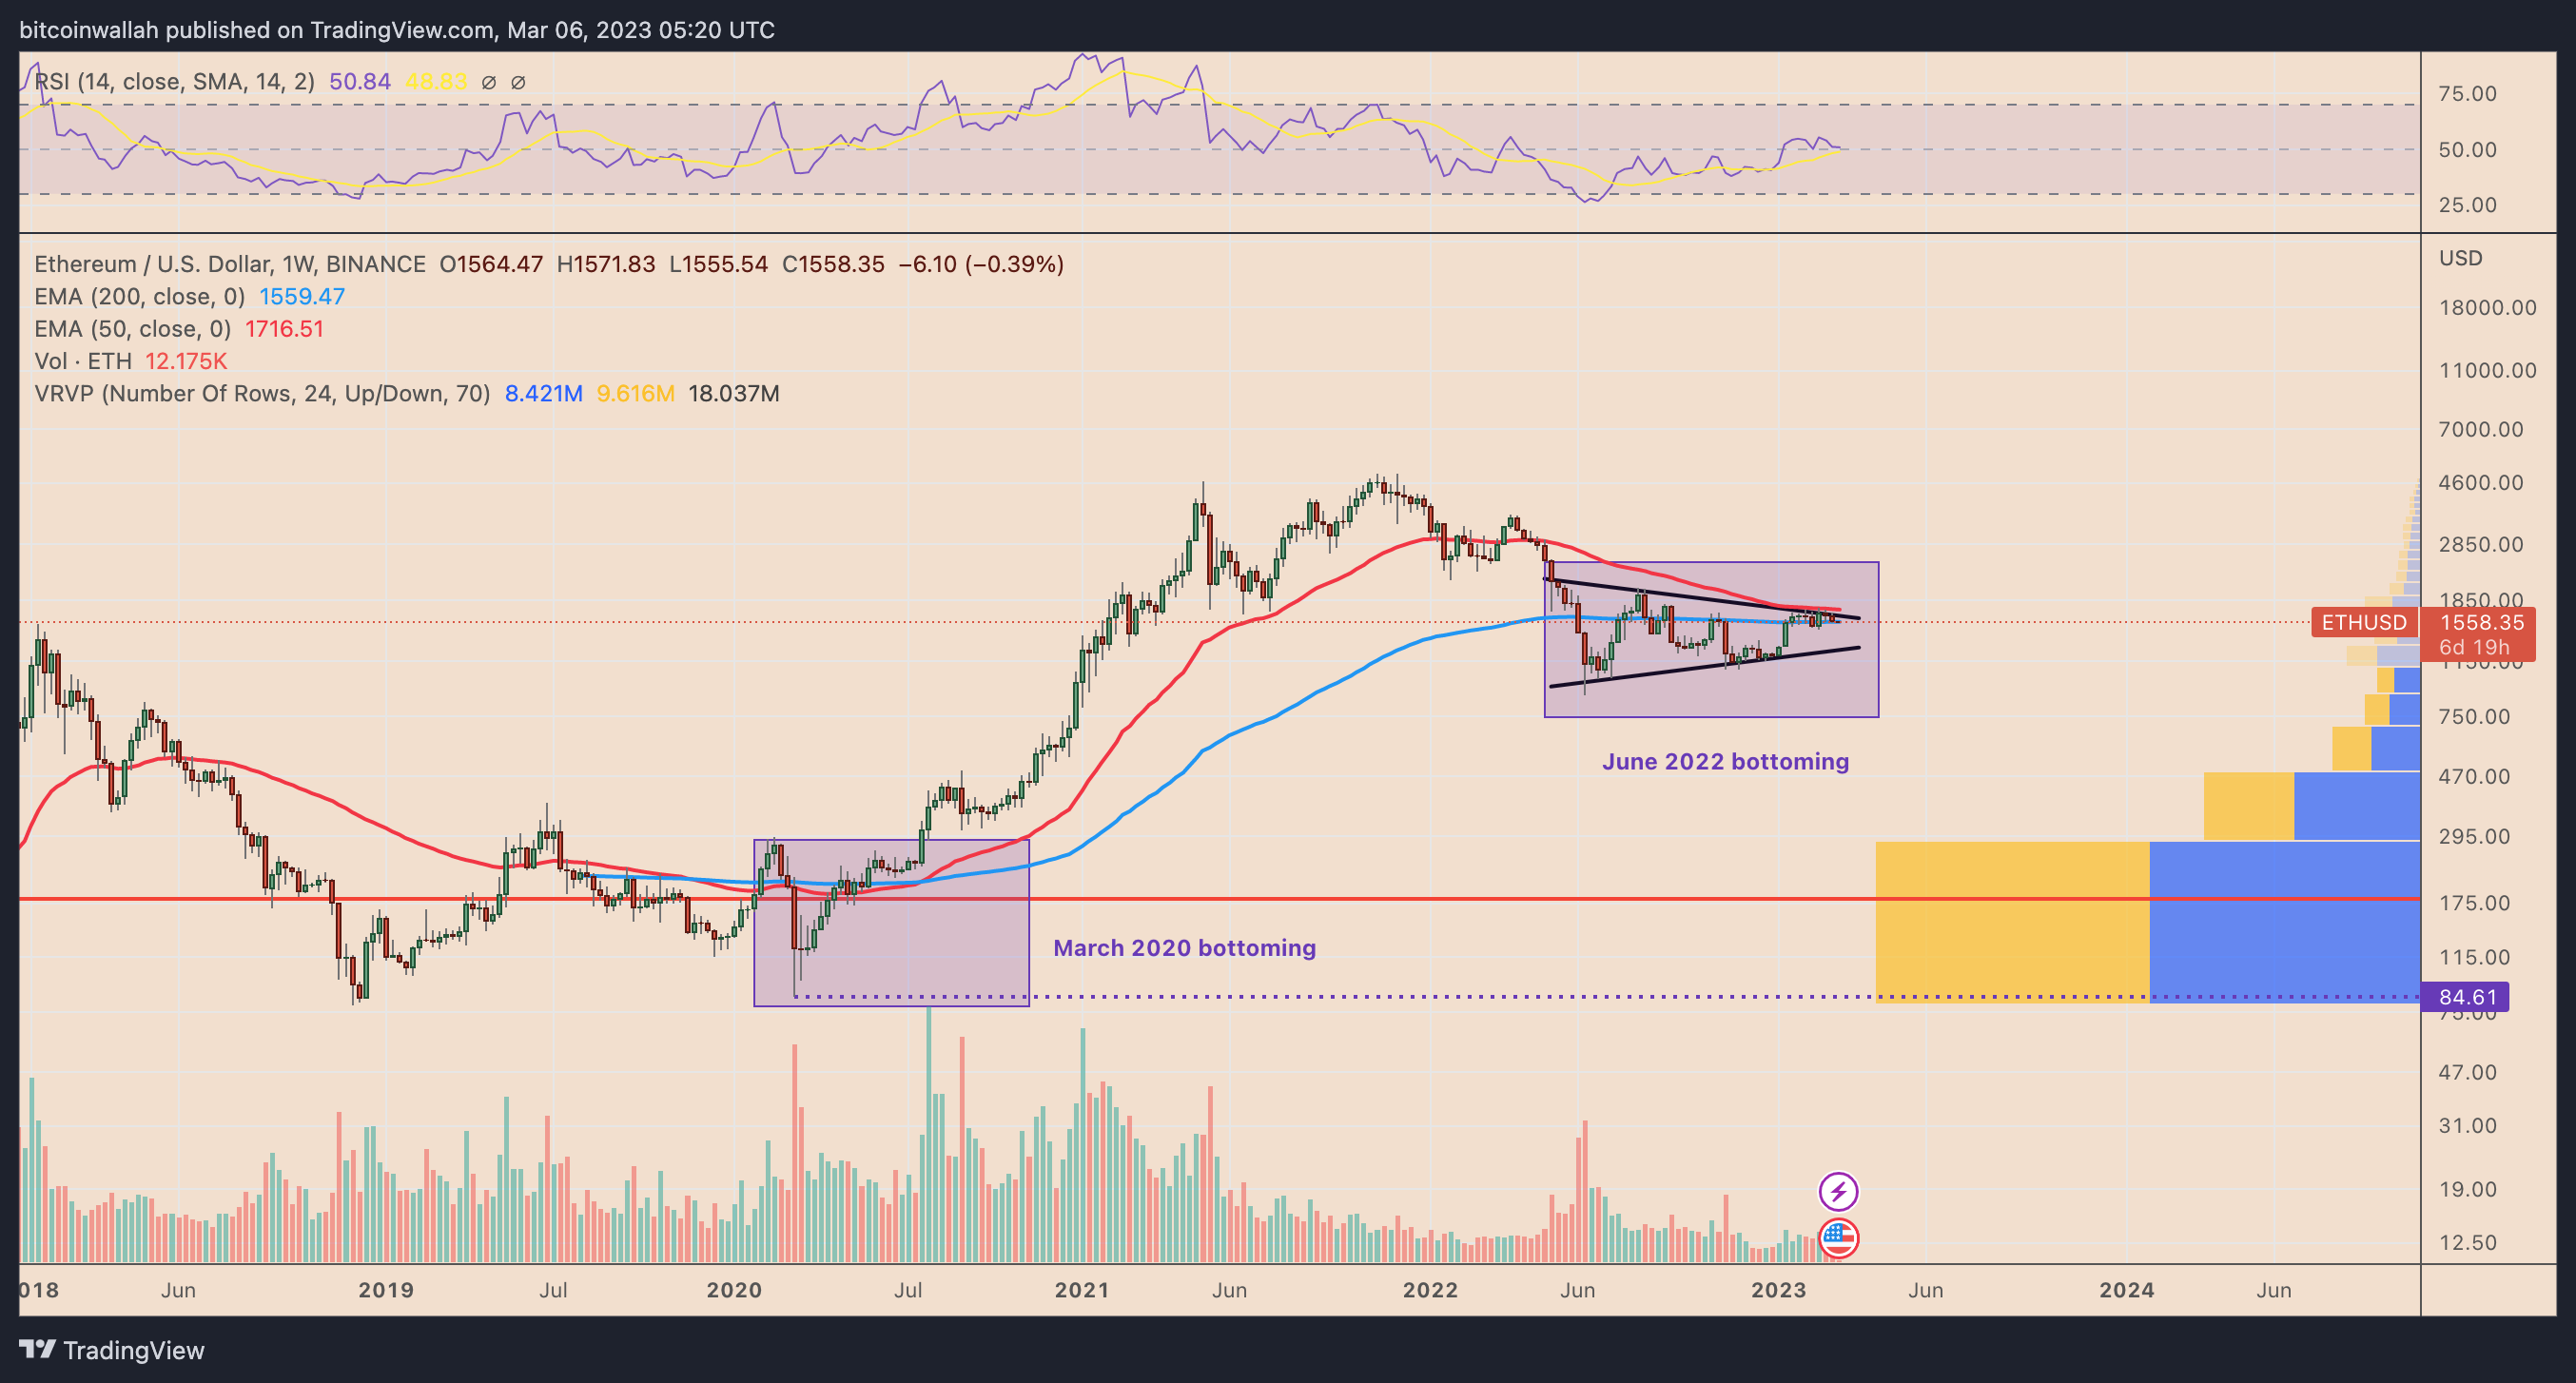
Ether volume profile falls 90% since March 2020
A “volume profile” indicator shows trading activity via prices, with blue indicating buying volume and yellow indicating selling volume.
In March 2020, when the market bottomed out, Ether’s volume profile on a weekly chart showed around 160 million ETH transactions in the price range of $85 to $270. At that time, the sales volume was greater than the purchase volume by around 4 million ETH.
But Ether buying volume regained momentum after ETH price surged above $270 in July 2020.
Notably, between July 2020 and November 2020, Ether’s volume profile showed around 64.25 million ETH trades in the $270 to $450 range, with buy volume outpacing sell volume by almost 1 million ETH.

The price-volume trend remained largely in sync with each other until November 2021, when ETH/USD hit its all-time high at around $4,950.
In other words, most traders bought Ether as its price rose, showing their confidence in the longevity of the bullish reversal that followed the March 2020 crash.
However, that confidence is lacking in the 2023 Ether market rally.
2022 ETH price floor differs from two years ago
Early on, Ether’s volume profile at the start of its June 2022 price recovery from $900 shows 12.50 million ETH transactions, more than 90% less than March 2020.
But despite a 75% price recovery, fewer traders have been participating in the potential Ether pool this time around compared to the start of the 2020 bull market.
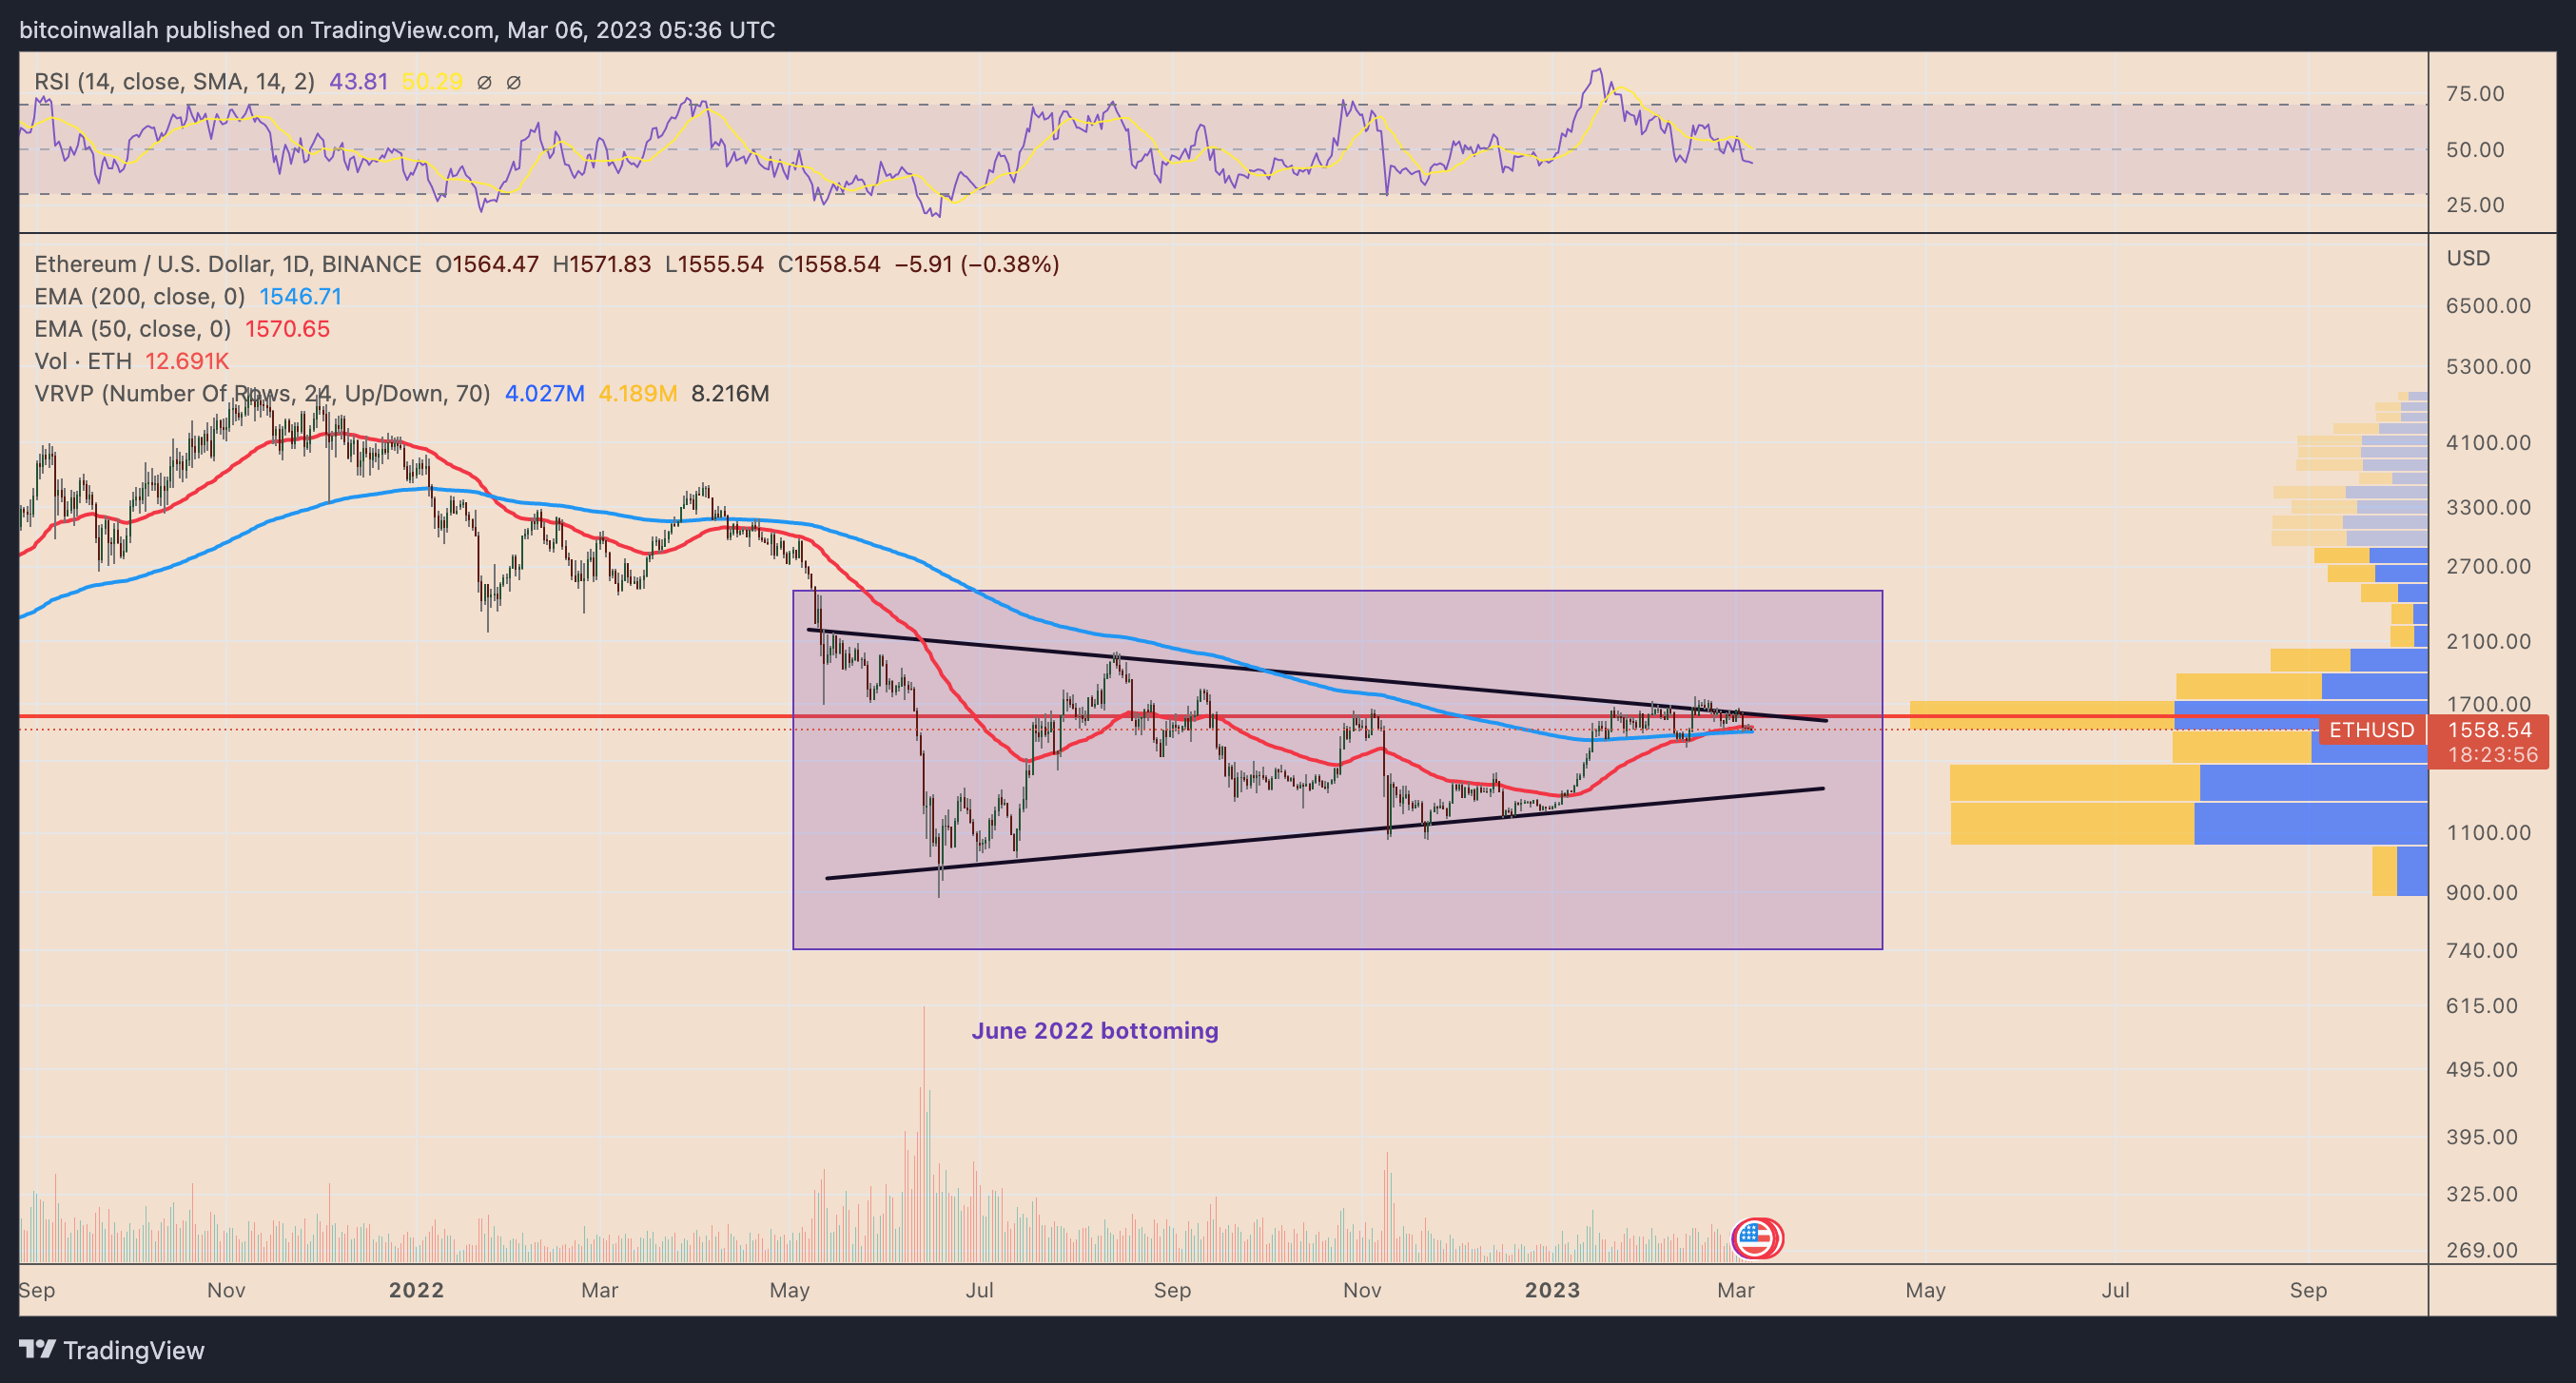
What is more worrying is the increase in sales volumes during the current ETH price rally.
For example, the red horizontal line on the daily chart below, called the “point of control” or POC, which represents the area with the most open trading positions, shows a net volume of 8.21 million ETH of around $1,550, with sellers outnumbering buyers. for 170,000 ETH transactions.

In other words, ETH’s ongoing price recovery might not have the legs it did in March 2020, especially when combined with the overall volume profile decline over the past two years.
Most Ether Investors Still Earning Profits
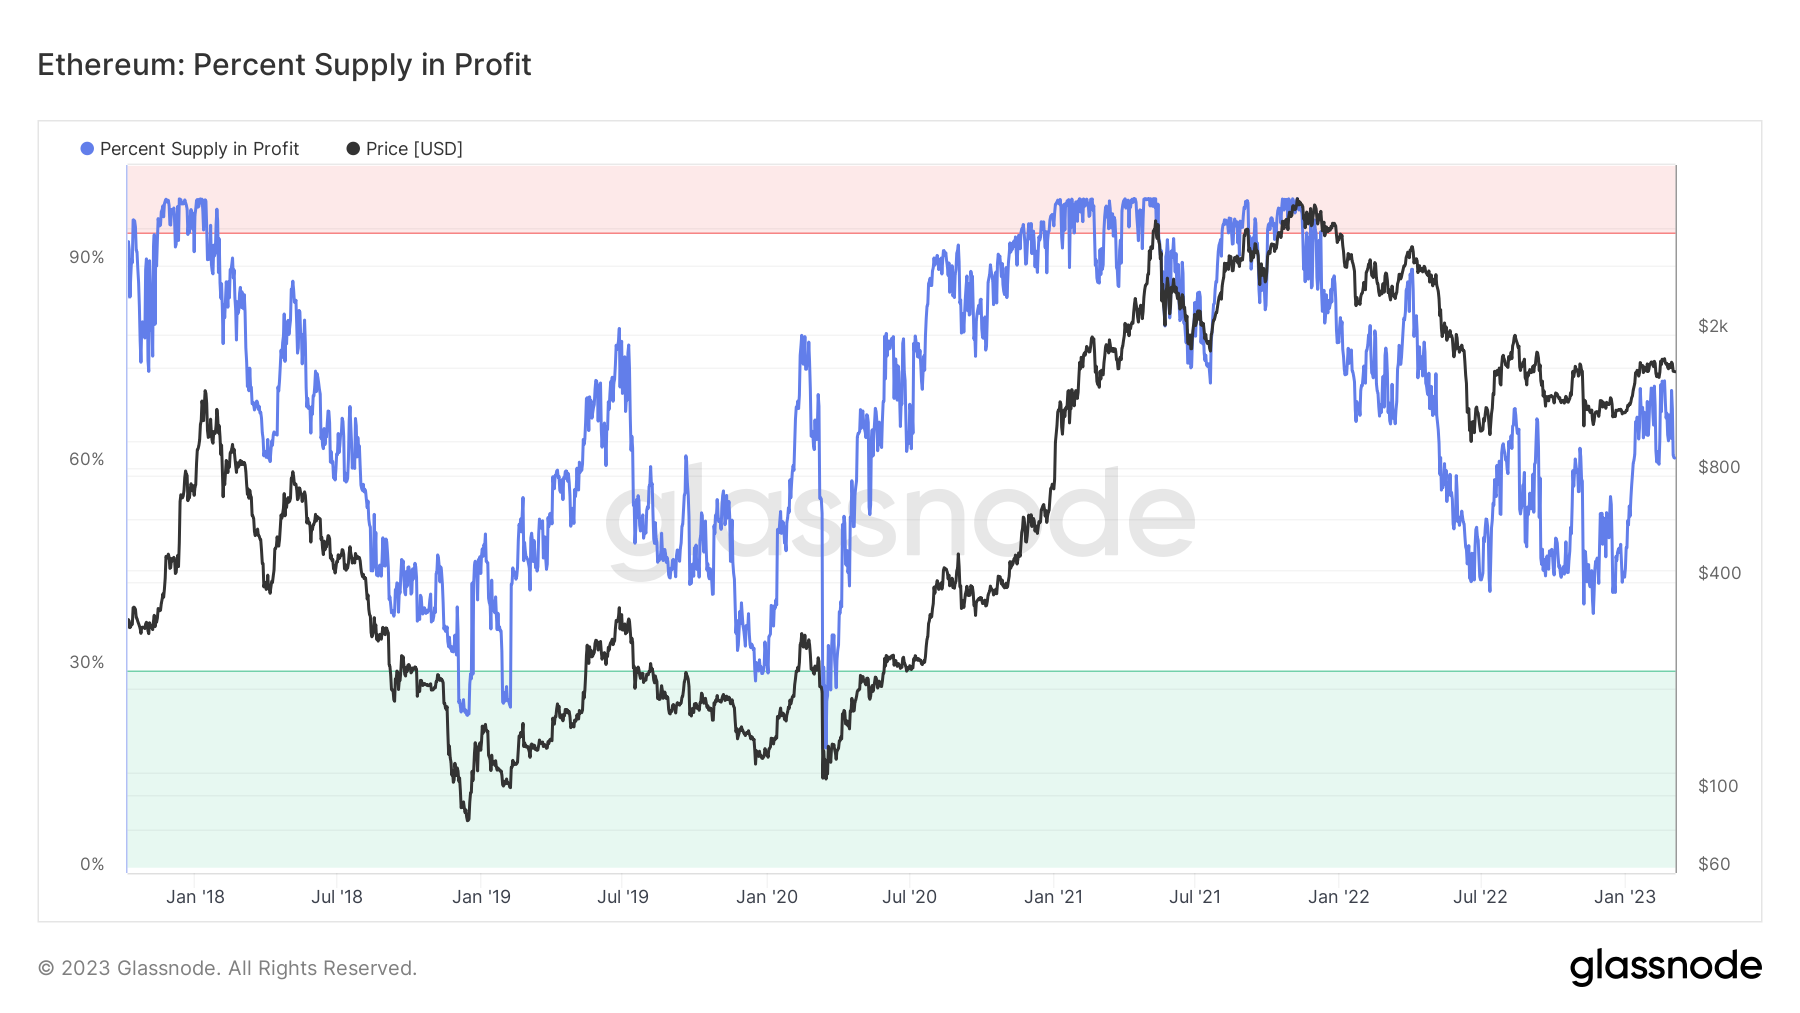
Further The negative signals for Ether come from one of Ethereum’s widely monitored on-chain metrics that tracks the percentage of the circulating supply of ETH in profit.
Related: Ethereum Eyes 25% Correction In March, But Bullish ETH Prices Have a Silver Lining
As of March 6, around 65% of ETH was bought at a lower price. In other words, the probability that investors will make a profit remains high in the event of a significant price decline.

Therefore, the price of Ether could hit a real bottom if the profit bid falls below 30% (green zone), which would reflect previous market cycles and the March 2020 bottom, as shown in the chart. former.
This article does not contain investment advice or recommendations. Every investment and trading move involves risk, and readers should do their own research when making a decision.


